Excel is a very powerful software. We can perform numerous operations on our datasets using Excel tools and features. With the help of various charts and graphs, you can clearly and effectively present survey results. Sometimes, our dataset includes Date and Time. In different business sectors or laboratories, we have to record certain values or stocks at a particular time on a definite day. A graph plot of this record information can play a significant role when presented to viewers. In this article, we’ll show you the step-by-step procedures to Plot Time over Multiple Days in Excel.
How to Plot Time over Multiple Days in Excel: Step by Step Procedures
Plotting the Time over Multiple Days can be a hassle for someone who isn’t used to graphs and charts in Excel. This article will break down the procedures so that anyone can follow along and learn. In this example, we’ll consider a practical experiment where we have to record values. Hence, our dataset will contain the record values and the day and time of recording. Therefore, go through the below steps carefully to perform the task.
STEP 1: Input Data in Excel
- First of all, type a heading so that viewers can understand what this dataset is about.
- Then, input the required Headers.
- In this case, input Date, Time, and Value.
- After that, insert the accurate day, time, and recorded values.
- See the following picture to understand clearly.

Read More: How to Create Graph from List of Dates in Excel
STEP 2: Modify Data
In this step, we will merge the Date and Time columns. It’s a simple task to do. So, follow the below process to carry out the operation.
- Firstly, insert a new column between Time and Value columns.
- To do that, right-click on the column header E.
- Select Insert from the Context Menu.
- It’ll return a blank column in the desired place.
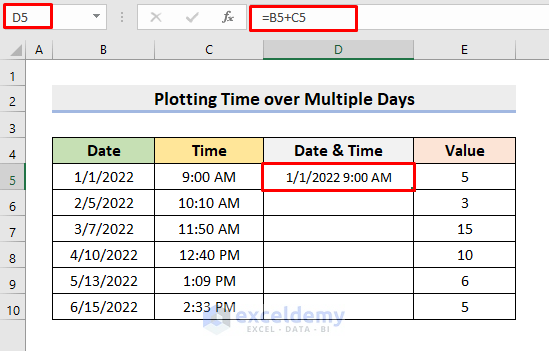
- Now, choose cell D5.
- Next, type the formula:
=B5+C5- Afterward, press Enter.
- Thus, it’ll return the Date and Time in a single cell.
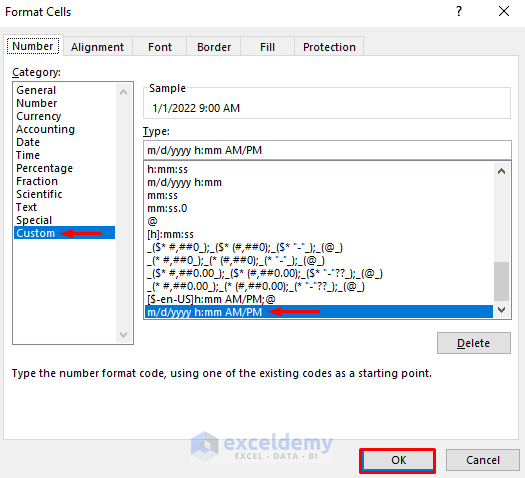
- To choose the desired format of the cell, select it first.
- Then, press the Ctrl and 1 keys together.
- As a result, you’ll get the Format Cells dialog box.
- Choose the required format.
- Press OK in the end.
- Look at the figure below. It demonstrates the operation.
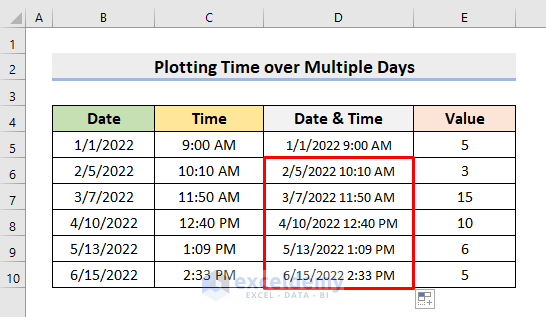
- Subsequently, use the AutoFill tool to complete the rest of the series.
Read More: How to Show Only Dates with Data in Excel Chart
STEP 3: Insert Line Chart
Now, we have to insert a graph plotting the necessary data values.
- First, select the range D5:E10.
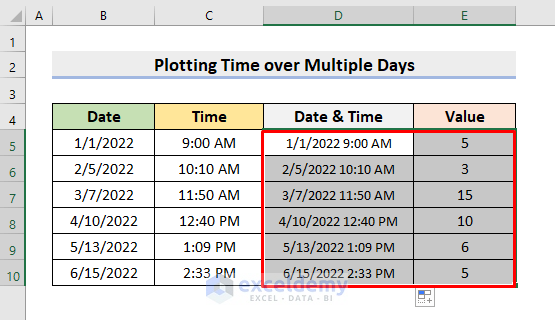
- Consequently, go to the Insert tab.
- Click the marked 2-D Line graph.
- Follow the picture below.

- Hence, you’ll get a line graph.

STEP 4: Format Axis to Plot Time over Multiple Days
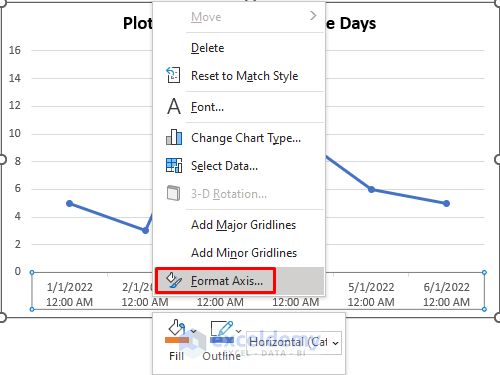
- In the beginning, select the Y-axis Legend.
- Then, right-click the mouse.
- Choose Format Axis from the Context Menu.
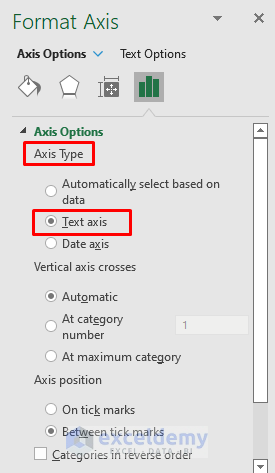
- As a result, it’ll return the Format Axis pane.
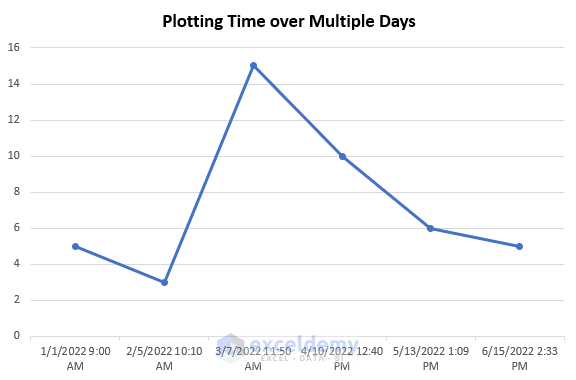
- Next, check the circle for Text Axis from the Axis Type.
- As a result, you’ll see the graph as displayed below.
Read More: How to Change Date Range in Excel Chart
Final Output
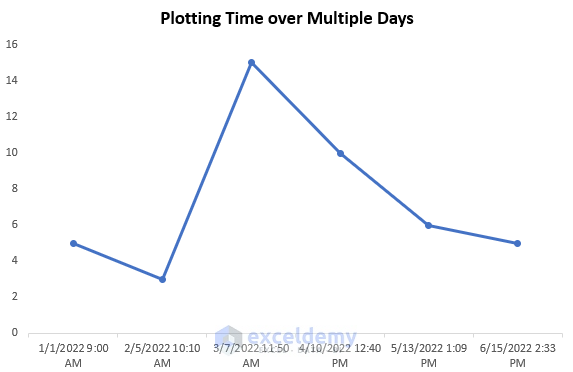
In the last step, we’ll delete the Gridlines to make our graph more appealing.
- For that purpose, select the Gridlines in the chart.
- Press Delete.
- Finally, the graph is ready.
- In this way, we can plot time over multiple days in Excel.
Download Practice Workbook
Download the following workbook to practice by yourself.
Conclusion
Henceforth, you will be able to Plot Time over Multiple Days in Excel following the above-described procedures. Keep using them and let us know if you have more ways to do the task. Don’t forget to drop comments, suggestions, or queries if you have any in the comment section below.
Related Articles
- Excel Chart by Month and Year
- How to Combine Daily and Monthly Data in Excel Chart
- How to Ignore Blank Cells with Formulas in Excel Chart
<< Go Back to Data for Excel Charts | Excel Charts | Learn Excel
Get FREE Advanced Excel Exercises with Solutions!

Doesn’t work if you have multiple times per day excel just gropus them all as one day
Hello, John! Can you please email us the Excel file containing the dataset with the problem? We’ll look into it & try to solve it asap.