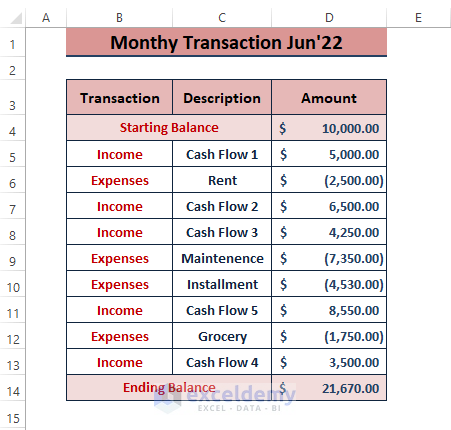
The dataset below showcases the June 2022 monthly transaction.
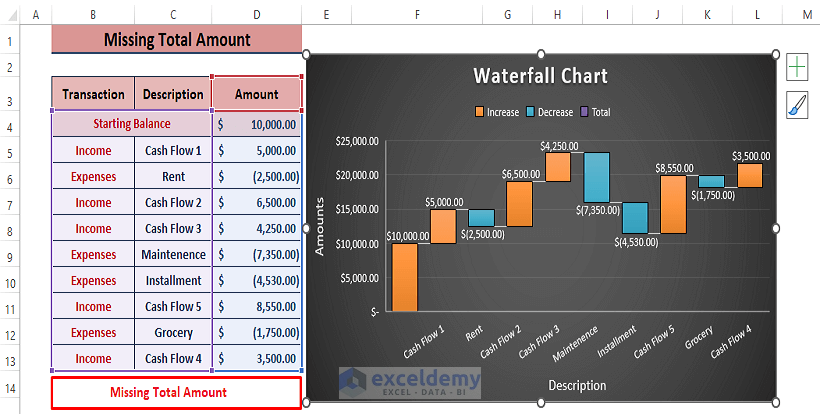
Using the data above, a Waterfall Chart was created ( Insert > Charts >Waterfall Chart).
The Total amount is not displayed:

Solution 1- Using the Double-click to Assign and Display Total in Waterfall Chart
Steps:
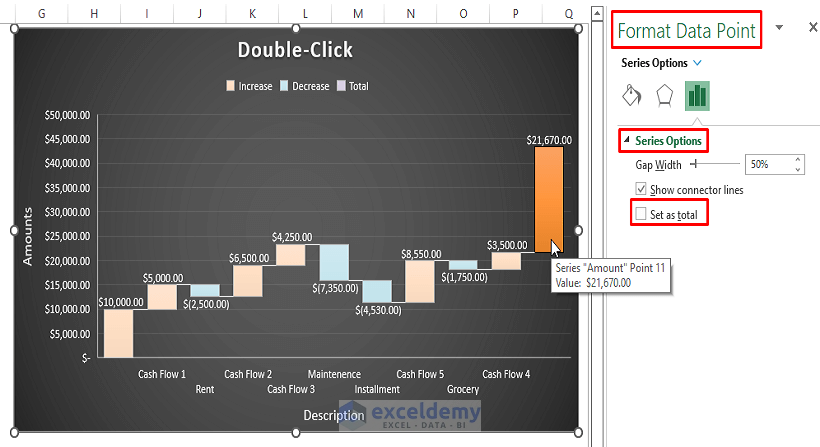
- Double-click the total amount in the Chart.
- In Format Data Point, select Series Options.
- Check Set as Total.
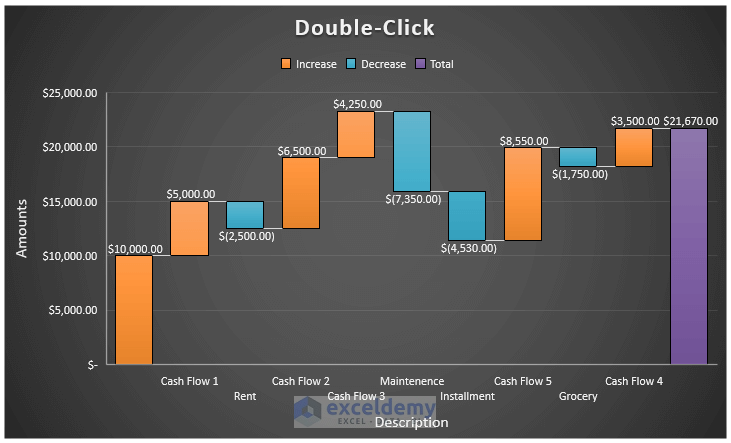
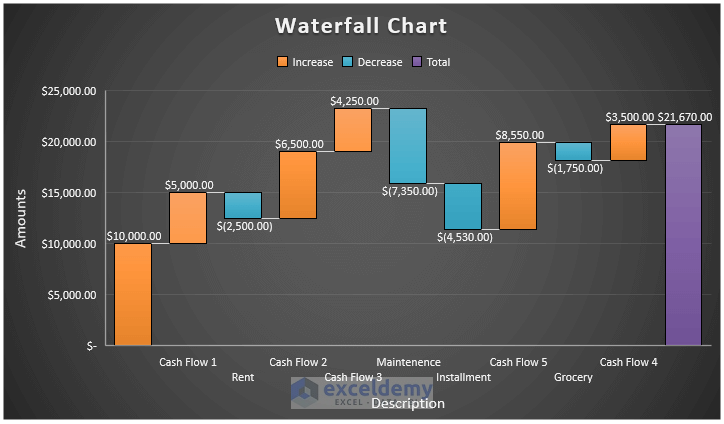
This is the output.
Solution 2 – Selecting Context Menu Options to Show the Total in an Excel Waterfall Chart
Steps:
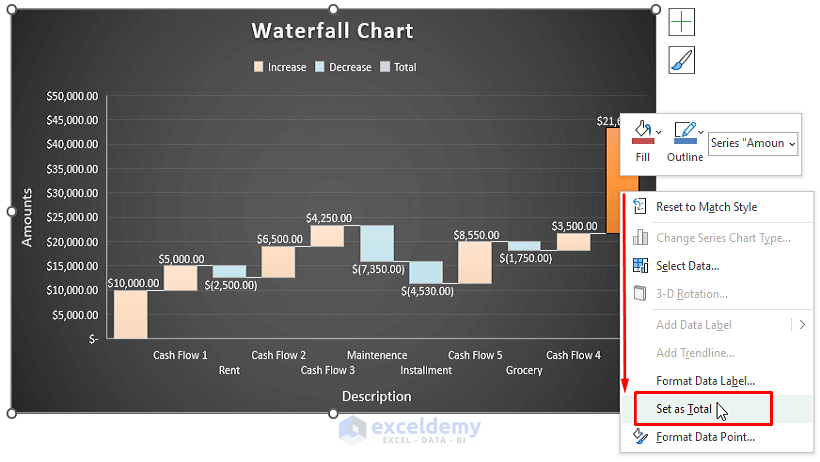
- Double-click the total amount.
- Right-click to display the Context Menu options.
- Select Set as Total.
This is the output.
Read More: How to Create a Stacked Waterfall Chart in Excel
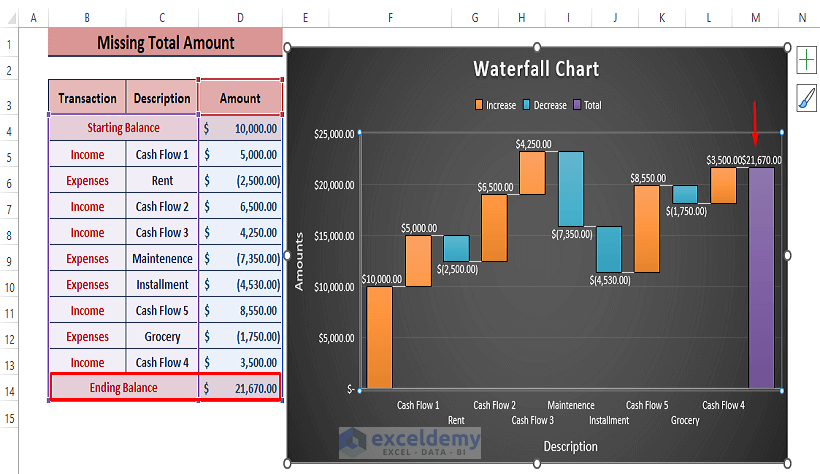
Solution 3 – Adding the Missing Total Amount to the Data Source
Steps:
- Find the total amount using the SUM function.
- Follow the steps described in Solution 1 or Solution 2.
Read More: How to Make a Waterfall Chart with Multiple Series in Excel
Download Excel Workbook
Related Articles
- How to Create Stacked Waterfall Chart with Multiple Series in Excel
- How to Make a Vertical Waterfall Chart in Excel
- Excel Waterfall Chart with Negative Values
- Excel Waterfall Chart Change Colors
<< Go Back to Waterfall Chart in Excel | Excel Charts | Learn Excel
Get FREE Advanced Excel Exercises with Solutions!
