Waterfall Chart in Excel

How to Create a Stacked Waterfall Chart with Multiple Series

What Is a Stacked Waterfall Chart in Excel? A stacked waterfall chart is a special type of graph that illustrates how values change across different ...
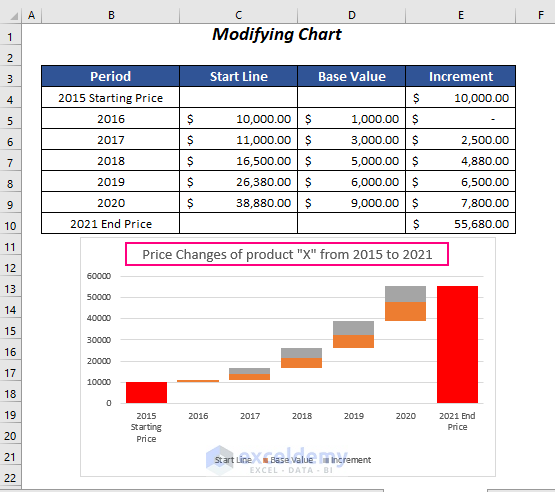
Excel Waterfall Chart Change Colors: 3 Methods

Method 1 - Format Data Structure for Waterfall Chart We will use a financial dataset that includes two products (A & B), each with quarterly ...

How to Make a Waterfall Chart with Multiple Series in Excel

The default waterfall chart feature in Excel 2016 and later versions can be used to create a waterfall chart with just one series. However, it is ...

Excel Waterfall Chart with Negative Values: 3 Suitable Methods

Method 1 - Using Waterfall Chart Step-1: Inserting a Waterfall Chart Select the entire dataset. Go to the Insert tab. From Insert ...

The Waterfall Chart Total is Not Showing – 3 Solutions

the dataset below showcases a monthly transaction in positive and negative amounts. Using the data above, a Waterfall Chart was created ( ...

How to Make a Vertical Waterfall Chart in Excel (with Easy Steps)

While working in Microsoft Excel with the sales-related worksheets, sometimes we need to make a vertical waterfall chart of sales to understand the ...

How to Create a Stacked Waterfall Chart in Excel (Easy Steps)

The following dataset contains records of price changes of product “X” from 2015 to 2021. A stacked waterfall chart will show the changes over the ...

Advanced Excel Exercises with Solutions PDF


ExcelDemy
Logo