Introduction to a Vertical Waterfall Chart
A waterfall chart is a graph that displays the original value, the values that have been added to it or removed from it, and the final sum as vertical rectangles. Excel uses different colors to distinguish between negative and positive numbers. These values of a rectangle whose size is proportionate to those values.
Although waterfall charts are frequently employed in the financial industry, they may be used to any subject where a starting value undergoes modifications. These adjustments may be detrimental or beneficial. The changes are shown between the beginning value and the final value in a waterfall chart, which starts with the starting value.
Some common applications of the Waterfall Chart are:
- Displaying income and expense statements
- Evaluating product profits
- Analyzing inventories or sales over time
- Highlighting budget changes for a project
- Demonstrating the worth of a product through time
- Establishing executive dashboards
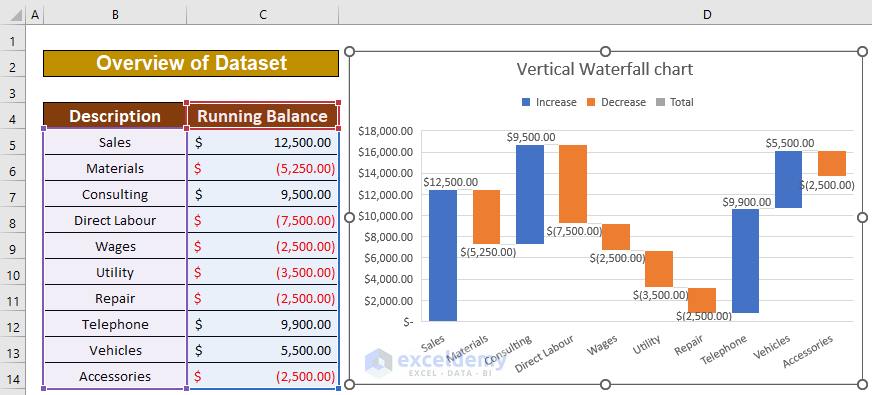
We have a dataset that contains information about the income and expense statement of the Armani group. The description of the income and expense, and the running balance are given in columns B and C, respectively. We will make a dataset with parameters and a Vertical Waterfall chart in Excel to understand the running balance of the Armani group.
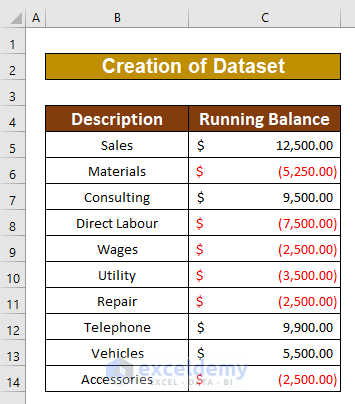
Step 1 – Creating a Dataset with Proper Parameters
- Input data relating to company profits and expenses in a single column.
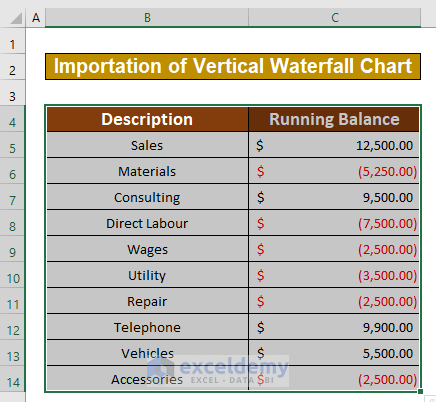
Step 2 – Making a Vertical Waterfall Chart in Excel
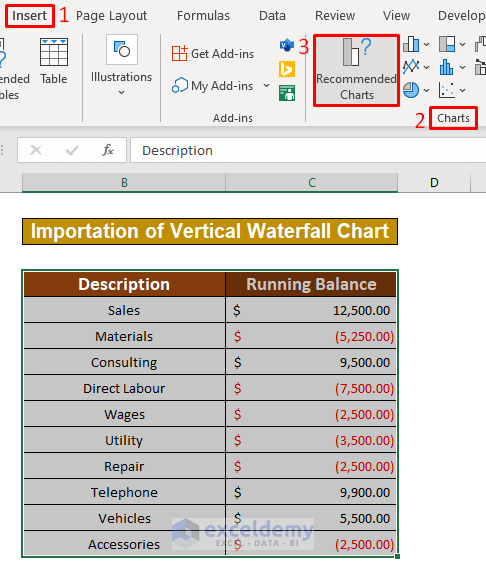
- Select the range of data to draw a vertical waterfall chart. From our dataset, we selected B4 to C14.
- Go to Insert, then to Charts, and select Recommended Charts.
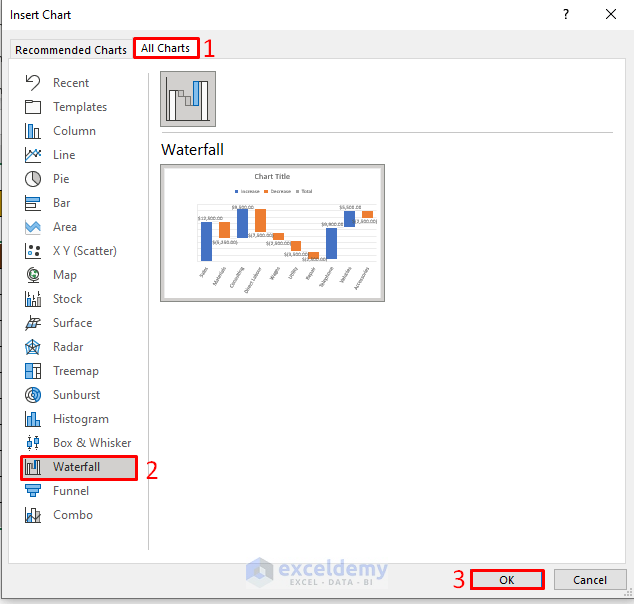
- An Insert Chart dialog box will appear. Select All Charts.
- Select the Waterfall option.
- Press the OK option.
- You’ll get a sample vertical waterfall chart using the dataset.
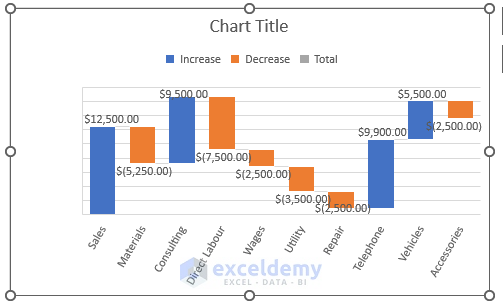
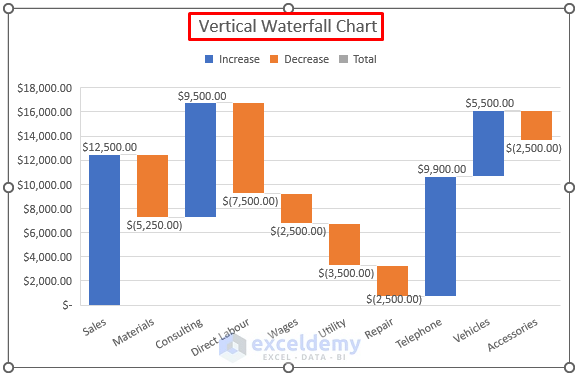
- Change the title of the chart by double-clicking on it and entering the new title.
Read More:How to Make a Waterfall Chart with Multiple Series in Excel
Things to Remember
- The #N/A! error arises when the formula or a function in the formula fails to find the referenced data.
- The #DIV/0! error happens when a value is divided by zero (0) or the cell reference is blank.
Download the Practice Workbook
Related Articles
- How to Create Stacked Waterfall Chart with Multiple Series in Excel
- Excel Waterfall Chart with Negative Values
- Excel Waterfall Chart Change Colors
- Excel Waterfall Chart Total Not Showing
- How to Create a Stacked Waterfall Chart in Excel
<< Go Back to Waterfall Chart in Excel | Excel Charts | Learn Excel
Get FREE Advanced Excel Exercises with Solutions!
