In this article, I’ll show you how you can get the source data range from a chart using VBA in Excel.
Excel VBA: Get Source Data Range from a Chart (Quick View)
Sub Get_Source_Data_Range_from_Chart()

Dim SheetName As Worksheet
Dim ChartName As Chart

Set SheetName = Worksheets("Sheet1")
Set ChartName = SheetName.ChartObjects("Chart 1").Chart

MsgBox ChartName.SeriesCollection(1).Formula

End Sub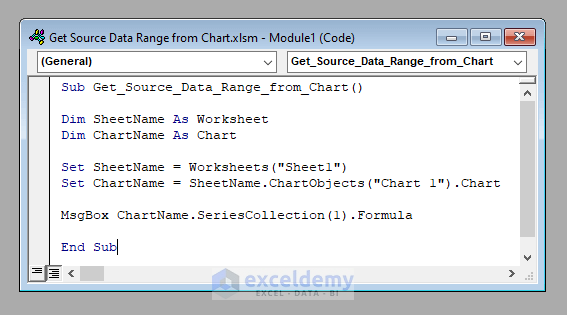
How to Get Source Data from a Chart Using Excel VBA: 5 Quick Steps
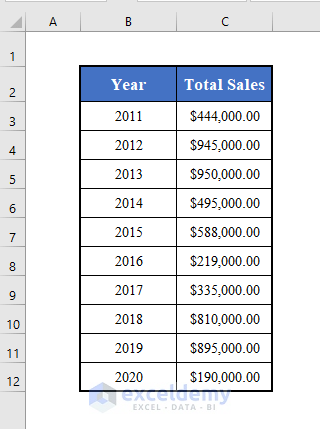
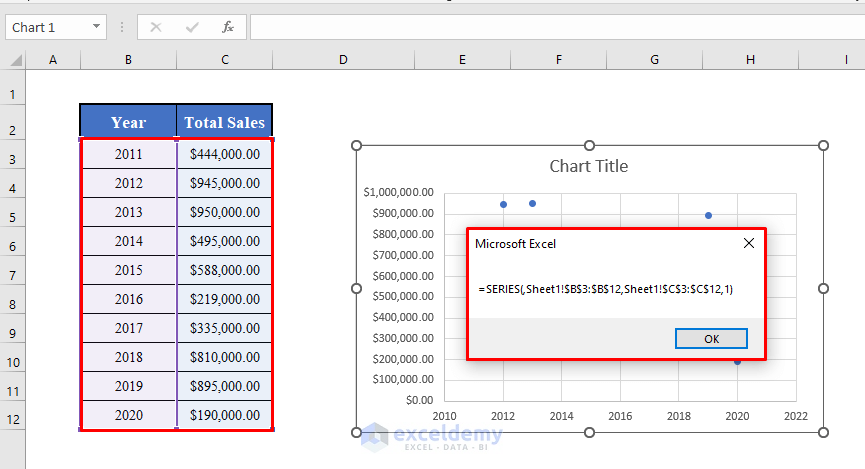
Here we’ve got a worksheet called Sheet1 that contains a company’s total sales for some years from 2011 to 2020.
Along with the data set, there is a chart called Chart 1.
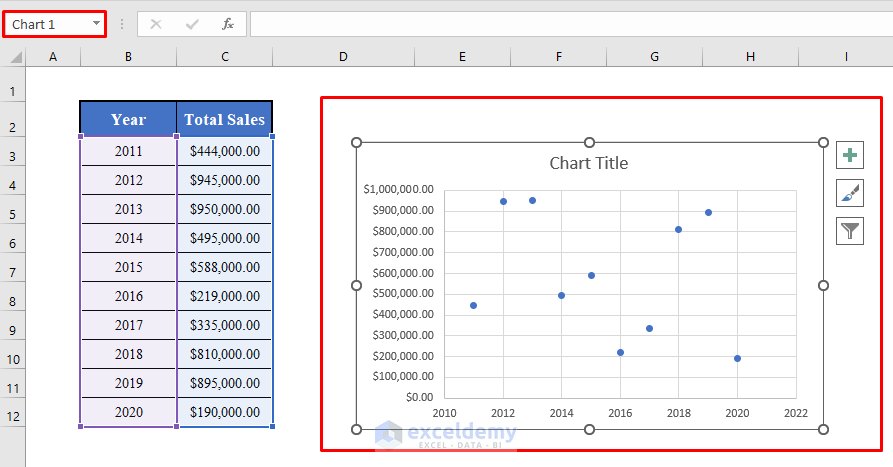
Our objective today is to get the source data set from this chart using VBA.
⧪ Step 1: Opening the Visual Basic Window
Press ALT+F11 on your keyboard to open the Visual Basic window.
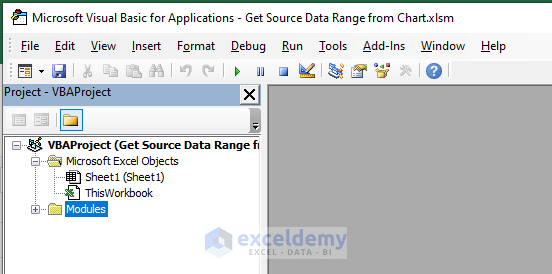
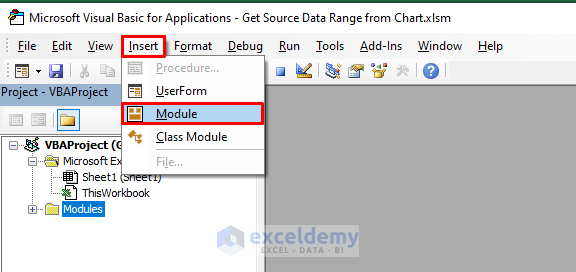
⧪ Step 2: Inserting a New Module
Go to the Insert > Module option in the toolbar. Click on Module. A new module called Module1 will open.
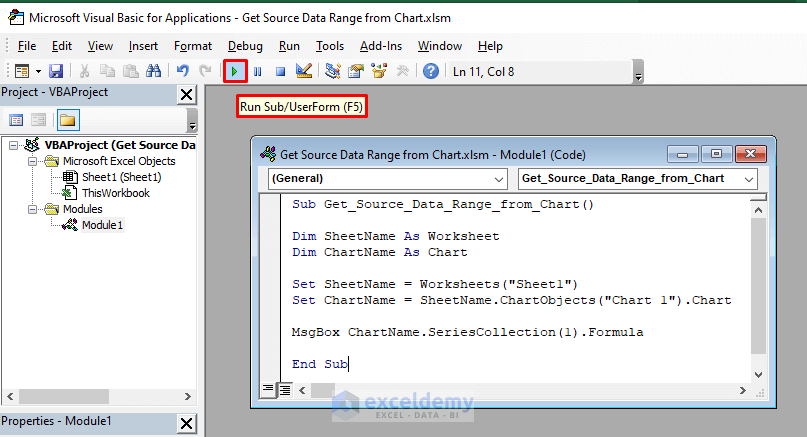
⧪ Step 3: Putting the VBA Code
This is the most important step. Put the following VBA Code in the module.
⧭ VBA Code:
Sub Get_Source_Data_Range_from_Chart()

Dim SheetName As Worksheet
Dim ChartName As Chart

Set SheetName = Worksheets("Sheet1")
Set ChartName = SheetName.ChartObjects("Chart 1").Chart

MsgBox ChartName.SeriesCollection(1).Formula

End Sub
⧭ Notes:
Here Sheet1 is the name of the worksheet, and Chart 1 is the name of the chart. Don’t forget to change these according to your needs.
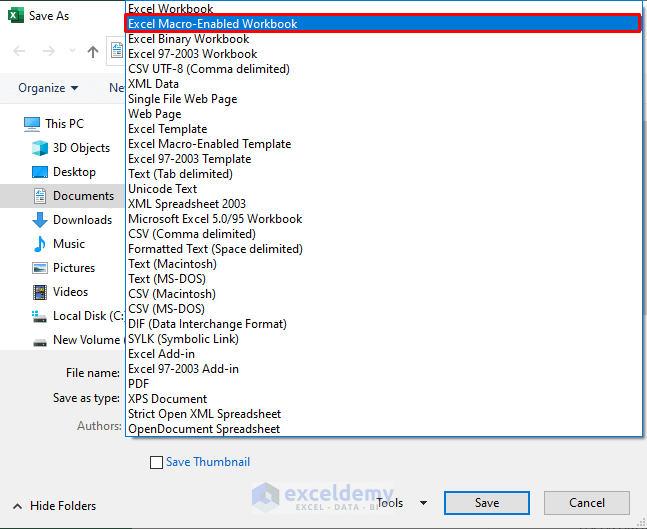
⧪ Step 4: Saving the Workbook as a XLSM File
Next, return to the workbook and save it as an Excel Macro-Enabled Workbook.
⧪ Step 5: The Final Output
Run the code from the Run Sub / UserForm option in the toolbar.
You’ll find a message box showing you the range of the X-axis data (Sheet1!B3:B12) and Y-axis data (Sheet1!C3:C12) respectively.
Read More: How to Get Data Points from a Graph in Excel
Things to Remember
Here I have focused only on getting the source data range from a chart. If you want to learn more about VBA objects, you can visit this link.
Download Practice Workbook
Download this practice workbook to exercise while you are reading this article.
Conclusion
Therefore, this is the process of creating a dynamic chart using VBA in Excel. Do you have any questions? Feel free to ask us.
Related Articles
- How to Select Data for a Chart in Excel
- Selecting Data in Different Columns for an Excel Chart
- How to Expand Chart Data Range in Excel
- How to Add Data Table in an Excel Chart
- How to Format Data Table in Excel Chart
- How to Add Data to an Existing Chart in Excel
- How to Add Data Points to an Existing Graph in Excel
- How to Create Excel Chart Using Data Range Based on Cell Value
<< Go Back to Data for Excel Charts | Excel Charts | Learn Excel
Get FREE Advanced Excel Exercises with Solutions!
