Method 1 – Using VBA Code
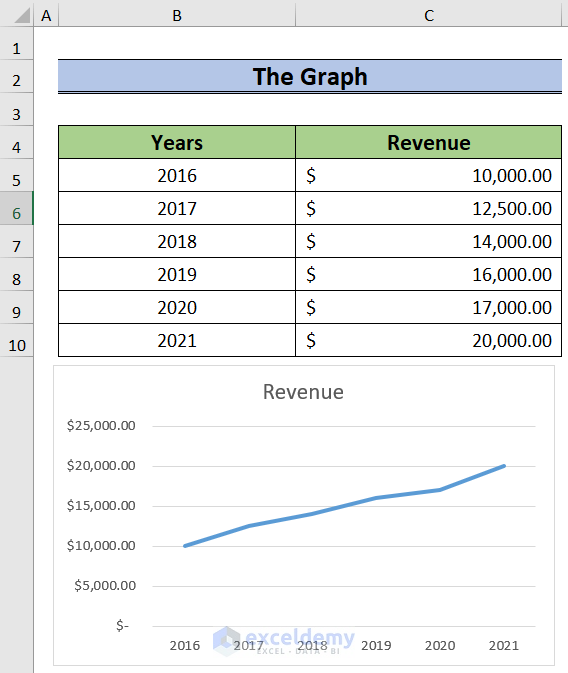
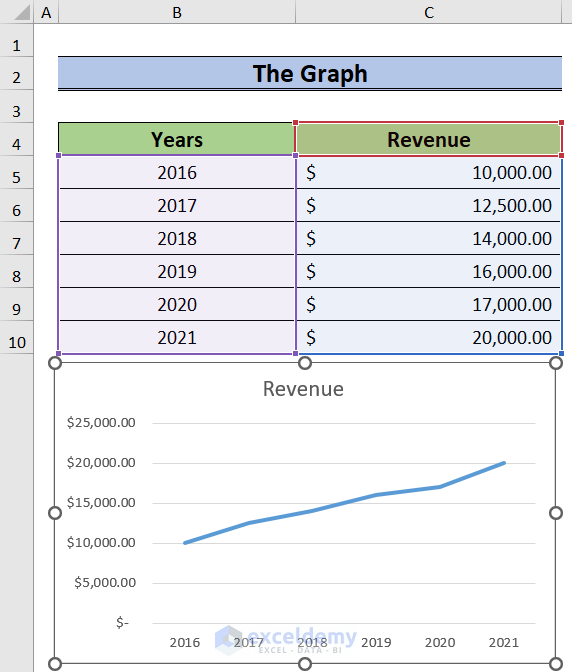
- Select the graph from which you want to extract data points.
- Create a new worksheet and name it VBACode.
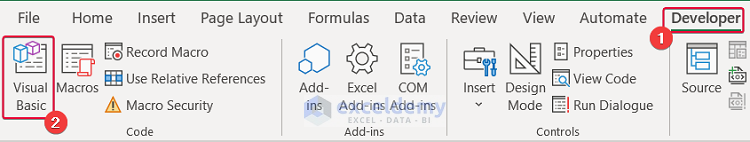
- Go to the Developer tab.
- Choose the Visual Basic tab.
- The Visual Basic window will be on the screen.
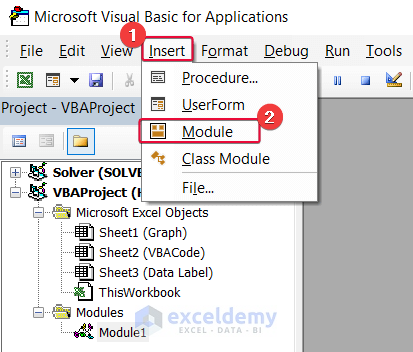
- In the Visual Basic window, select the Insert tab and select Module.
- Enter the following code in the module.
Sub GetDataPoints()
    Dim aM_num As Integer
    Dim aM_series As Object
    On Error Resume Next
    aM_Count = 3
    aM_num = UBound(Application.ActiveChart.SeriesCollection(1).Values)
    Application.Worksheets("VBACode").Cells(4, 2) = "X Values"
    With Application.Worksheets("VBACode")
        .Range(.Cells(5, 2), _
        .Cells(aM_num + 4, 2)) = _
        Application.Transpose(ActiveChart.SeriesCollection(1).XValues)
    End With
    For Each aM_series In Application.ActiveChart.SeriesCollection
        Application.Worksheets("VBACode").Cells(4, aM_Count) = aM_series.Name
        With Application.Worksheets("VBACode")
            .Range(.Cells(5, aM_Count), _
            .Cells(aM_num + 4, aM_Count)) = _
            Application.WorksheetFunction.Transpose(aM_series.Values)
        End With
        aM_Count = aM_Count + 1
    Next
End Sub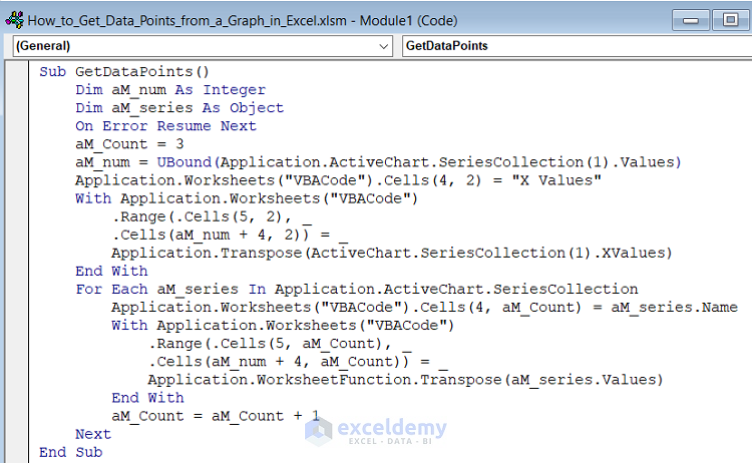
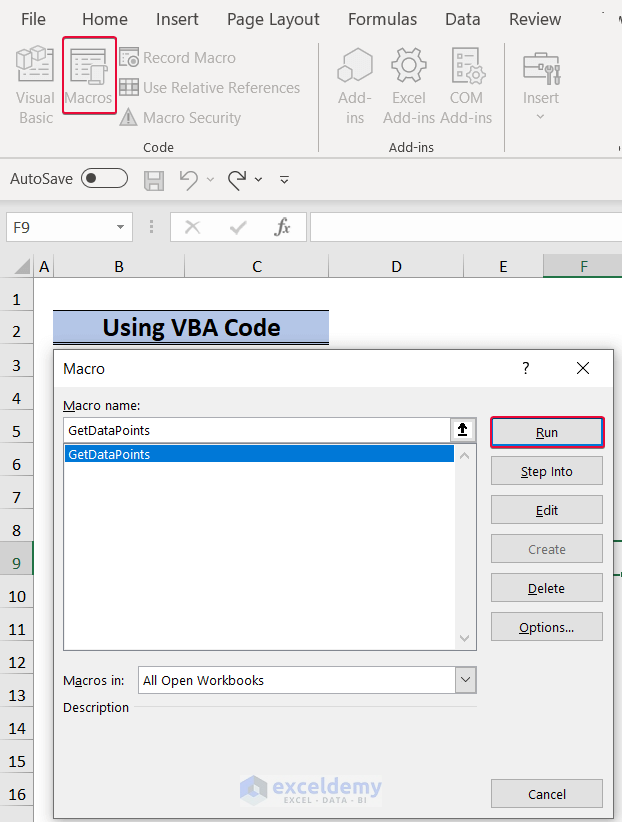
- Go back to your sheet where you want to get the data points and run the macro named GetDataPoints.
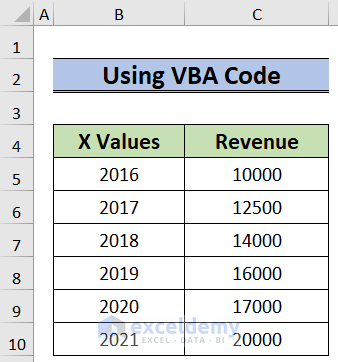
- As a result, we will get the data points from the graph in a tabular form.
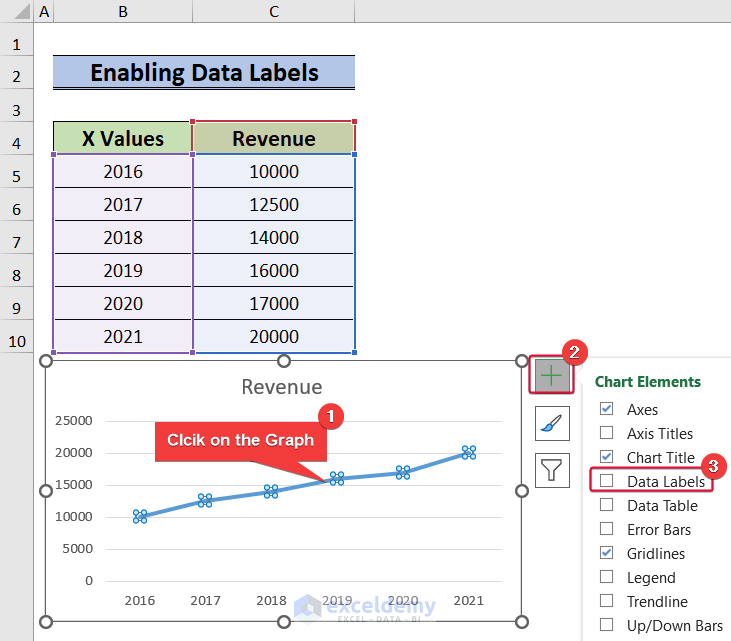
Method 2 – Enabling Data Labels
This is an easy and quick way to get the data points from a graph. Here, we will not get the data in a tabular form. However, we will see it on the graph in a more convenient way.
Steps:
- Click on the graph to select it.
- Choose the plus sign to the top right corner of the graph.
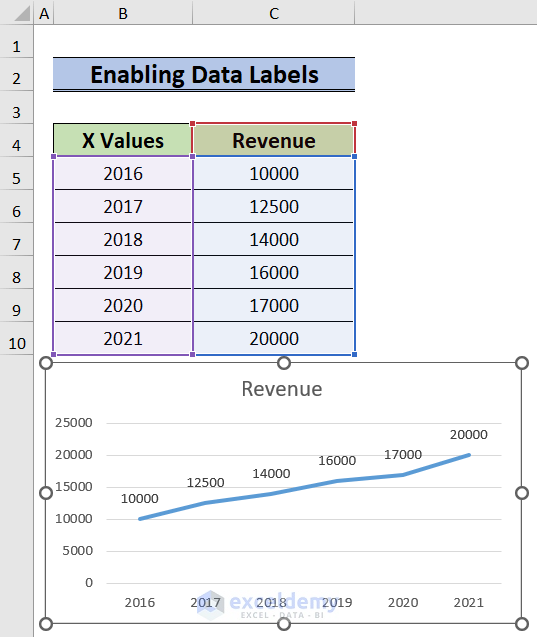
- From the available options, mark the Data Labels option to enable the data labels.
- You will see the data points on the graph.
Read More: How to Add Data Table in an Excel Chart
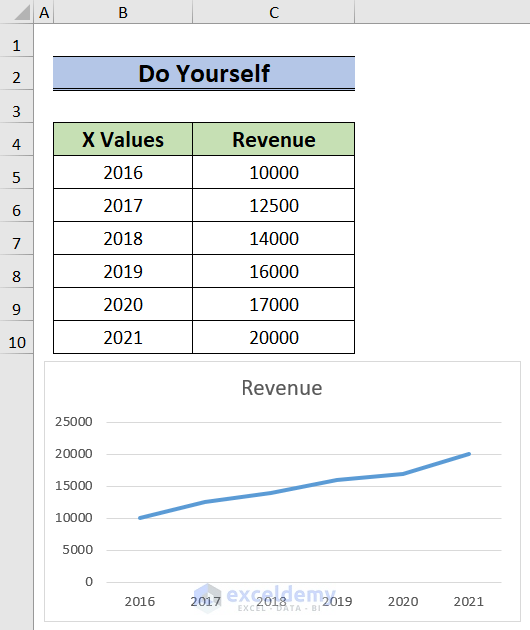
Practice Section
Herewith the dataset of this article enabling you to practice on your own.
Download Practice Workbook
You can download the practice workbook from here:
Related Articles
- How to Select Data for a Chart in Excel
- Selecting Data in Different Columns for an Excel Chart
- How to Expand Chart Data Range in Excel
- How to Format Data Table in Excel Chart
- How to Add Data to an Existing Chart in Excel
- How to Add Data Points to an Existing Graph in Excel
- How to Create Excel Chart Using Data Range Based on Cell Value
<< Go Back to Data for Excel Charts | Excel Charts | Learn Excel
Get FREE Advanced Excel Exercises with Solutions!
