Macros can cause serious damage to your computer. It happens to erase files or install malware. Thus, users need to know about Excel macro security. ...
Task 1 - Data Cleaning and Formatting
1.1 Removing Blank Rows
Sometimes your dataset may have blank rows that you need to remove. However, removing ...
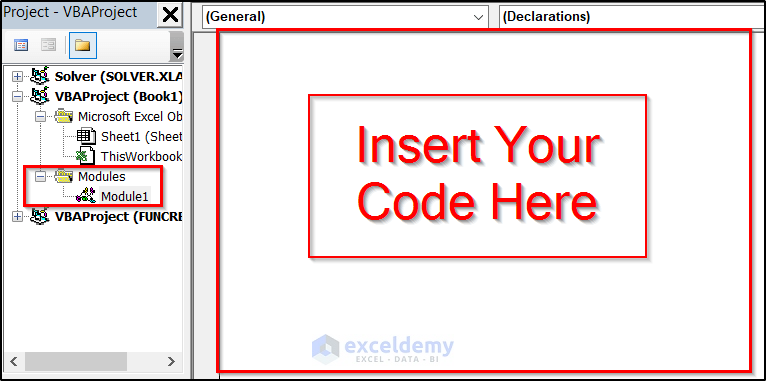
How to Enable Solver Feature in Excel
You can access Solver by choosing Data ➪ Analyze ➪ Solver. Sometimes this command isn’t available. You have to ...
What Is Goal Seek in Excel?
Goal Seek is a built-in tool in Excel that performs What-If Analysis. It helps you find the specific input value needed ...
Before analyzing how to use scenario manager in Excel to do scenario analysis, it's important to understand the limitations of one and two variable ...