Method 1 – Optimizing Investment Portfolio Based on Total Yield Using Excel Solver
Steps
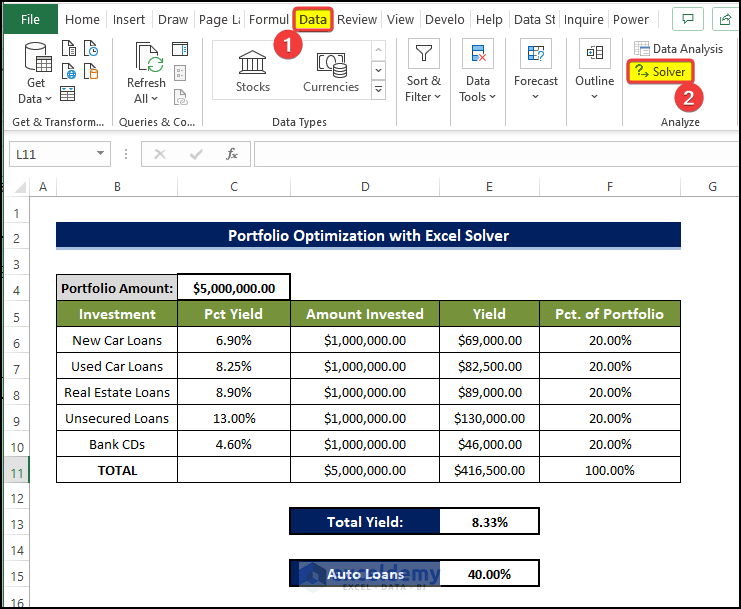
- Use the following steps to set up the Solver Parameters dialog box. This dialog box appears when you choose Data ➪ Analysis ➪ Solver.
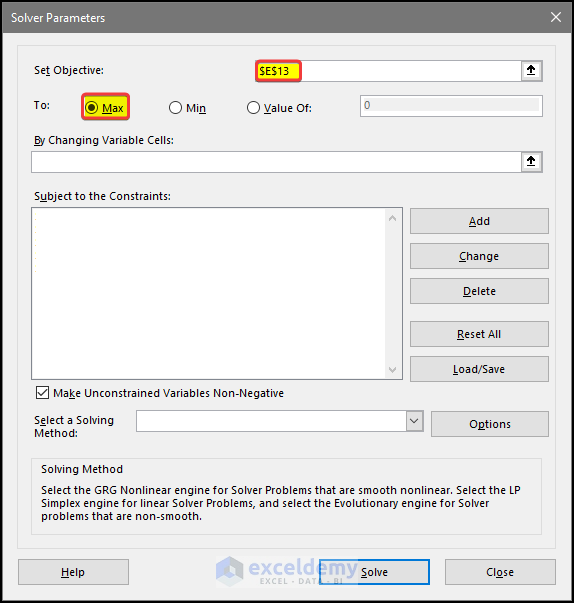
- Set Objective field with this value: $E$13.
- Select the radio button for the Max option in To Control.
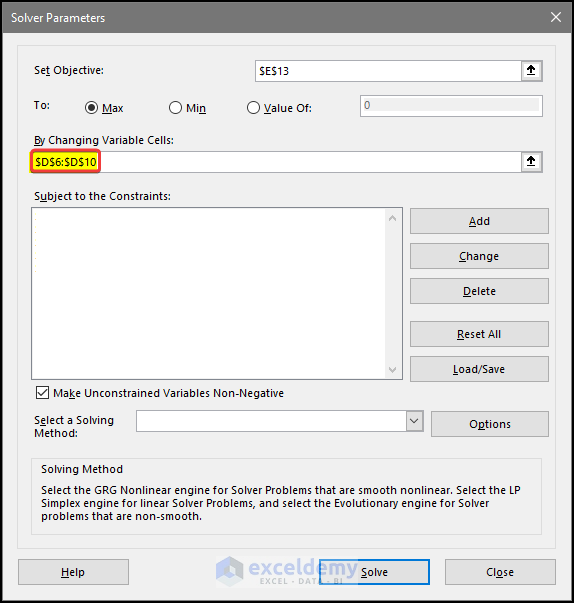
- Select cell $D$6 to $D$10 to fill the field By Changing Variable Cells. This field will show $D$6:$D$10.
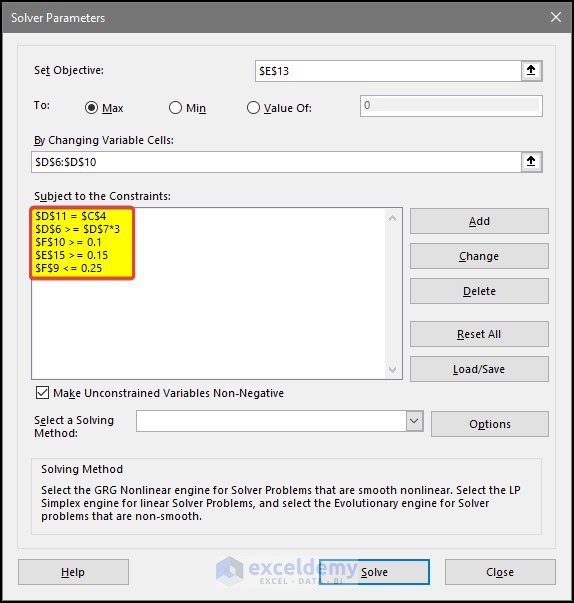
- Add constraints one by one. The constraints are: $D$11= $C$4 $D$6 >= $D$7*3, $E$15>= 0.15, $F$9 <= 0.25, $F$10>= 0.1. These constraints will be shown in the Subject to the Constraints field.
- Select the Make Unconstrained Variables Non-Negative check box.
- Select GRG Nonlinear from the Select a Solving Method drop-down list.
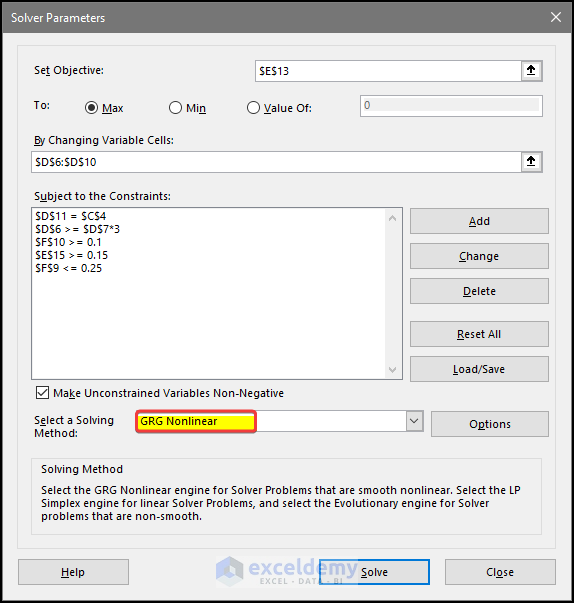
- Click the Solve button. Click OK.
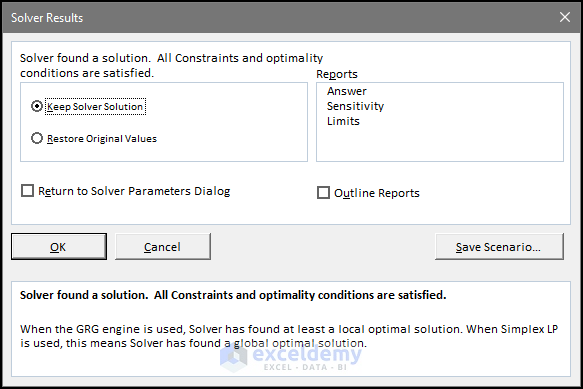
- There will be another dialog box in which you need to select the result types.
- You need to select Keep Solver Solution. Otherwise, the values will revert to the original values.
- From the right side of the dialog box, select all the options in the Reports.
- Click OK.
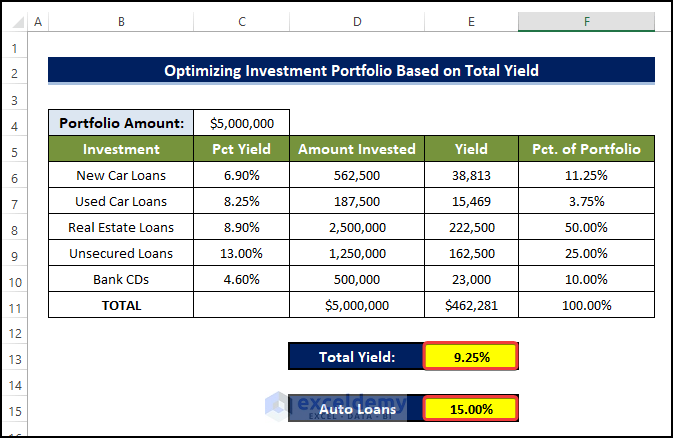
- We entered 1,000,000 in the changing cells as the starting values. When you run Solver with these parameters, it produces the solution shown in the following figure with a total yield of 9.25%.
- The Auto Loans values also changed to 15%.
- This is how we got the highest optimization value of Total Yield considering all the constraints.
- We completed the optimization of an investment portfolio using the Excel solver.
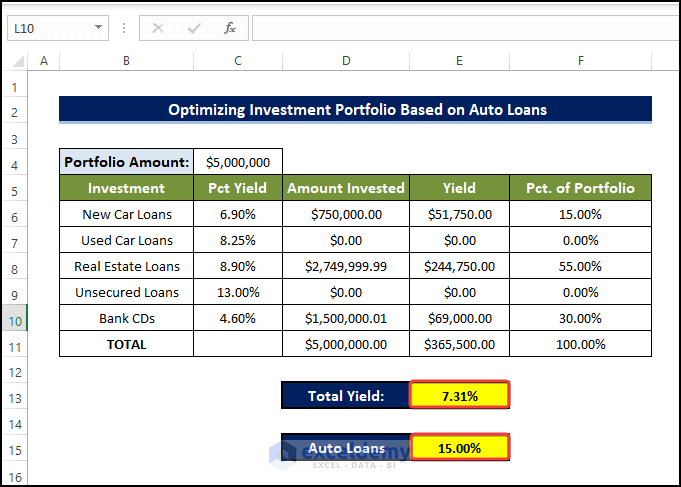
Method 2 – Optimizing Investment Portfolio Based on Auto Loans with Excel Solver.
Steps
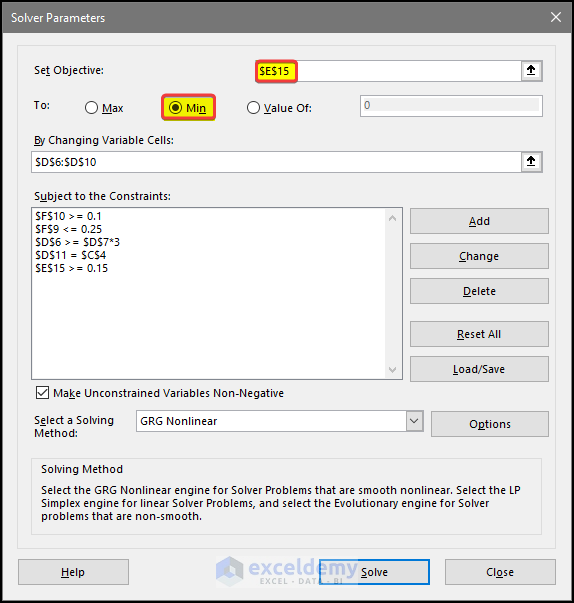
- Our main goal would be to try to minimize the Auto Loans.
- We will select cell E15. The location of the Auto Loan value as the Objective value.
- We will set Min in the To option.
- Doing this will ensure that the solution will try to minimize the Auto Loan value while finding a solution.
- Keep all the constraints the same as before.
- Click OK.
- Clicking OK will run the Solver.
- After clicking Solver, the solver will Run.
- After the Solver had finished the calculation, we can see that the minimized Loan value based on all the other criteria is present.
- It also affected the Total Yield value in E13.
Download Practice Workbook
Download this practice workbook below.
Related Articles
- How to Use Excel Solver to Rate Sports Team
- How to Use Excel Solver to Determine Which Projects Should Be Undertaken?
- Solving Sequencing Problems Using Excel Solver Solution
- Solving Transportation or Distribution Problems Using Excel Solver
- How to Assign Work Using Evolutionary Solver in Excel
- Resource Allocation in Excel
- Solving Equations in Excel
<< Go Back to Excel Solver Examples | Solver in Excel | Learn Excel
Get FREE Advanced Excel Exercises with Solutions!

I am using MarketXLS. It works great for me.
Hi , Great Work !!! Thank you for this informative post ! Do you get these questions from a book or do you write them yourself ? If you use a book would you mind sharing its name if not again wonderful post . All the best.
Dear Evangeline,
Thanks for your appreciation. Our experienced writers write these questions after doing a complete research about the topic.
Regards
ExcelDemy