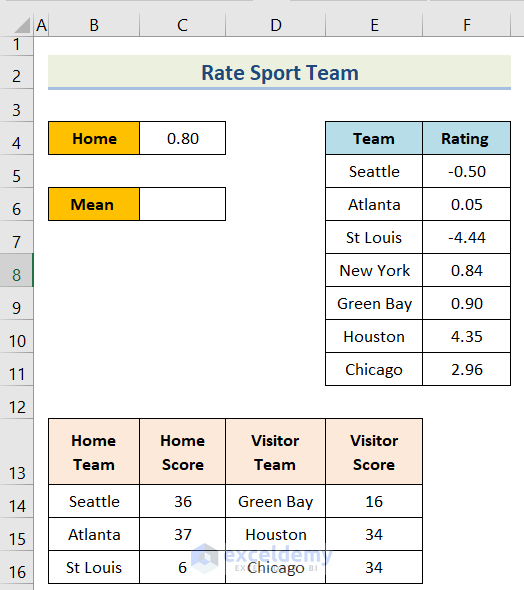
Step 1 – Create a Dataset
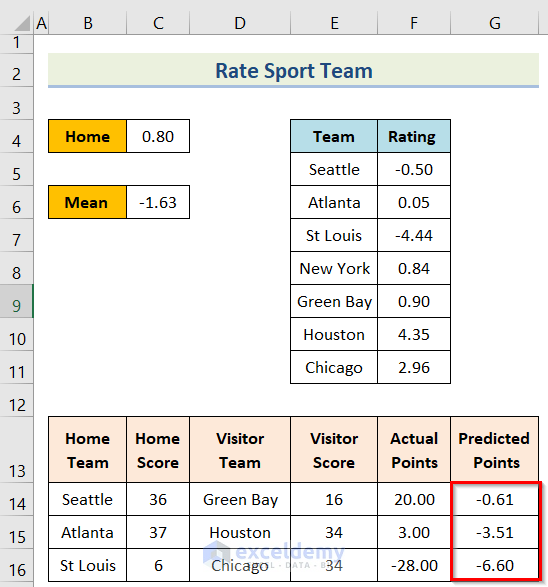
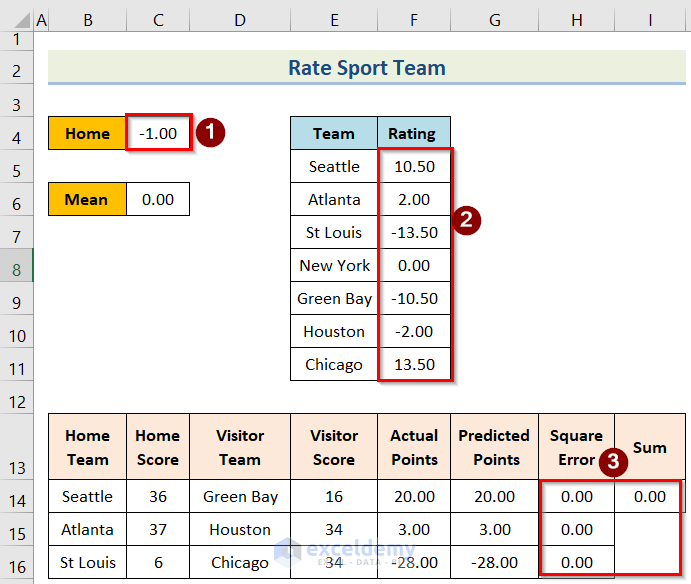
This sample dataset showcases Home in B4, Mean in B6, Team in E4, Rating in F4. Home Team, Home Score, Visitor Team, and Visitor Score are displayed in columns B, C, D, and E.
Step 2 -Determine Predicted Points
- Enter the following formula in C6.
=AVERAGE($F$5:$F$7)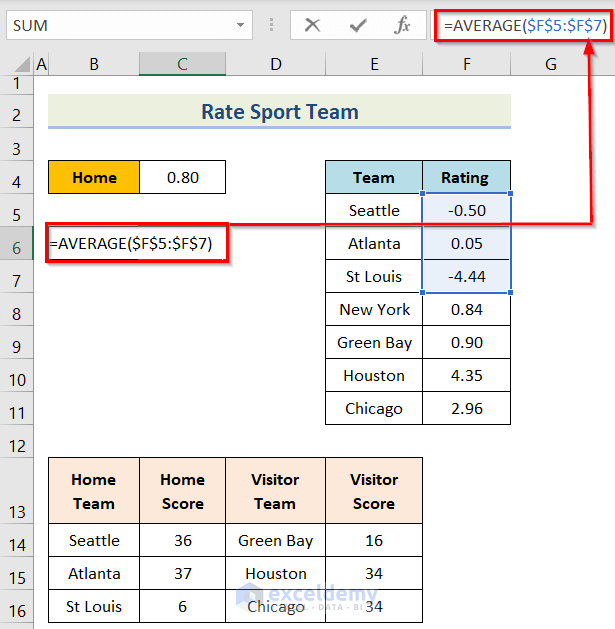
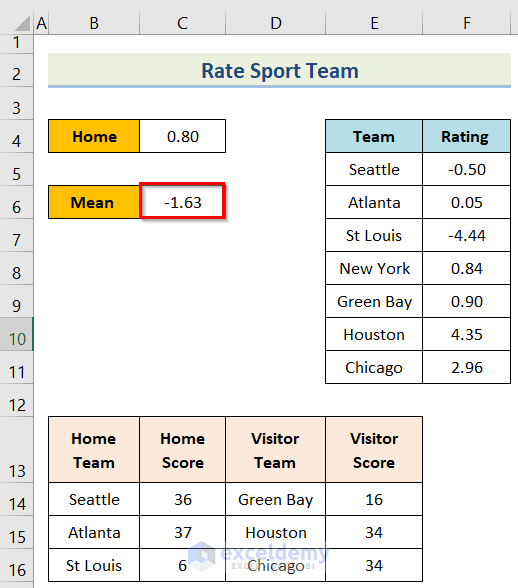
- Press Enter.
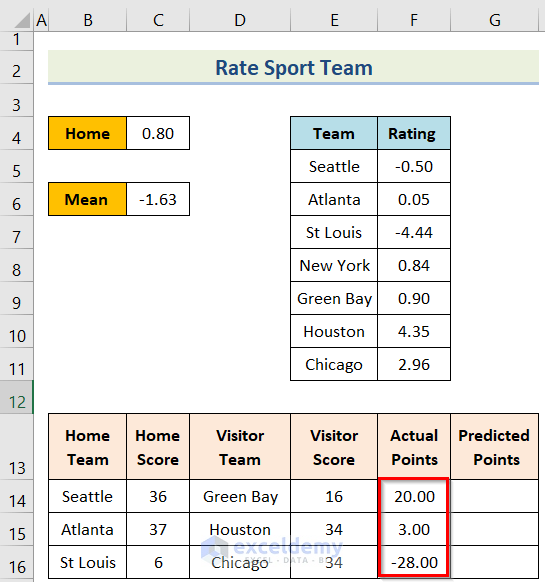
- Enter the following formula in F14.
=$C14-$E14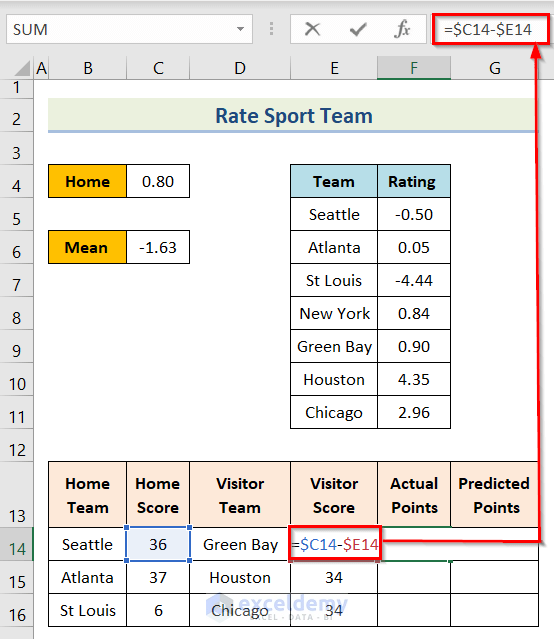
- Press Enter.
- Drag down the Fill Handle to see the result in the rest of the cells.
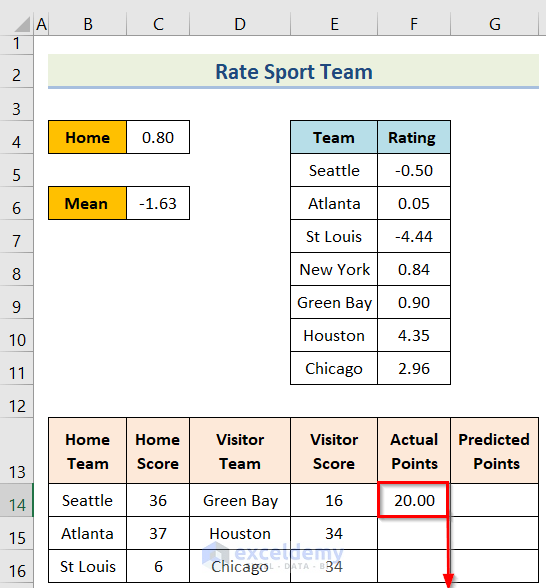
This is the output.
- Enter the following formula in G14.
=$C$4+VLOOKUP(B14,$E$5:$F$11,2,FALSE)-VLOOKUP(D14,$E$5:$F$11,2,FALSE)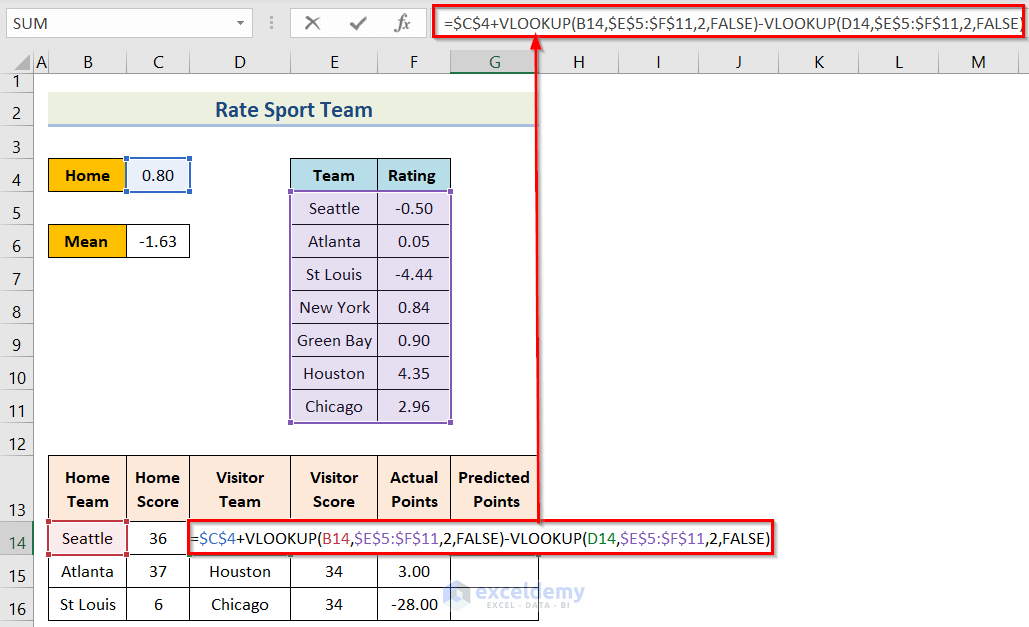
- Press Enter.
- Drag down the Fill Handle to see the result in the rest of the cells.
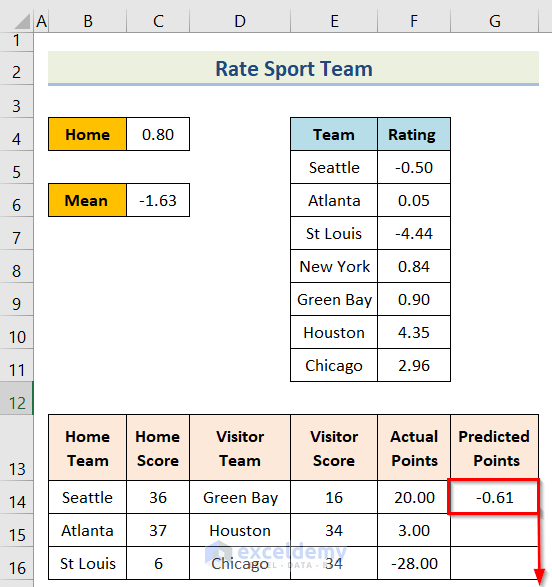
This is the output.
Step 3 – Calculate the Square Error
- Enter the following formula in H14.
=(F14-G14)^2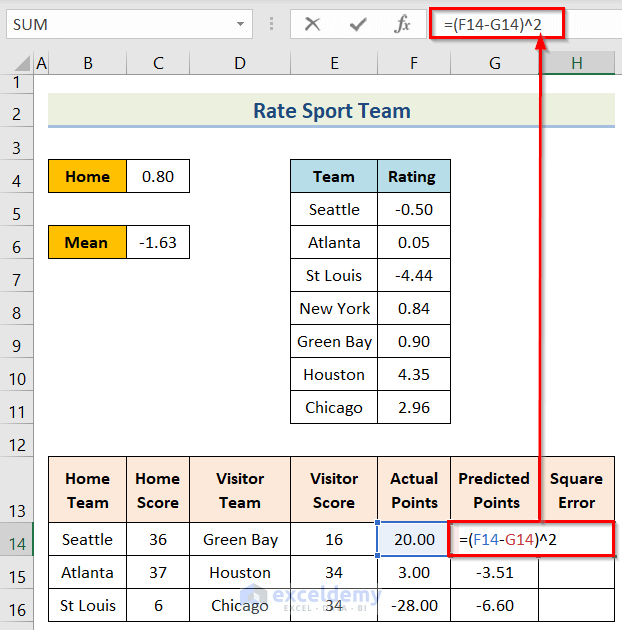
- Press Enter.
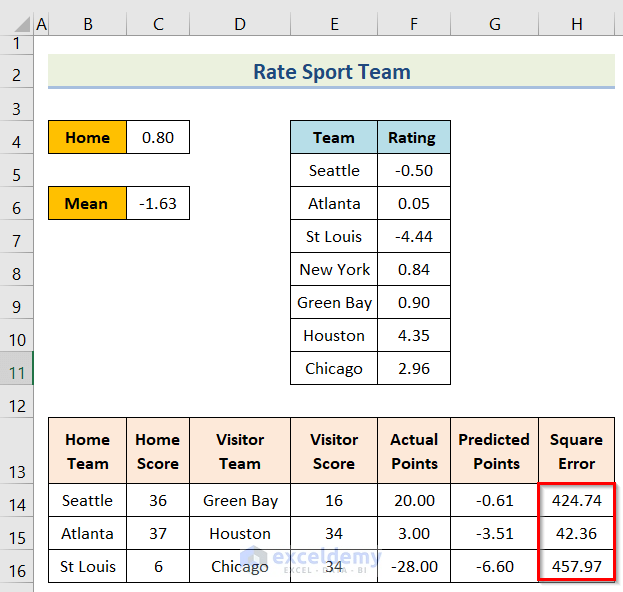
- Drag down the Fill Handle to see the result in the rest of the cells.
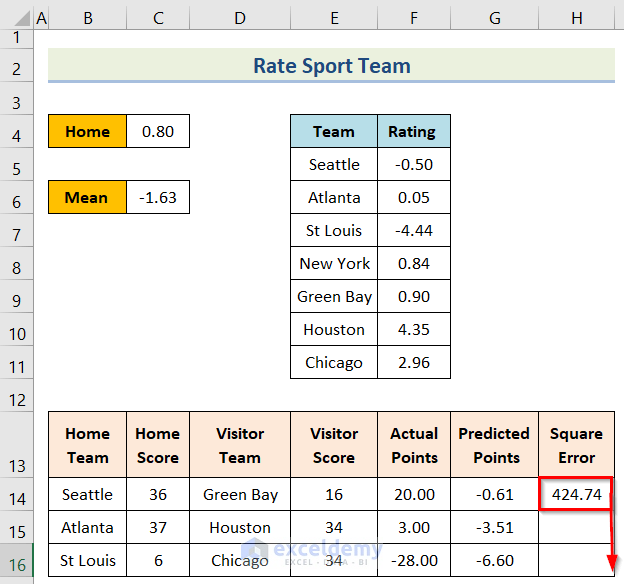
This is the output.
Read More: How to Do Portfolio Optimization Using Excel Solver
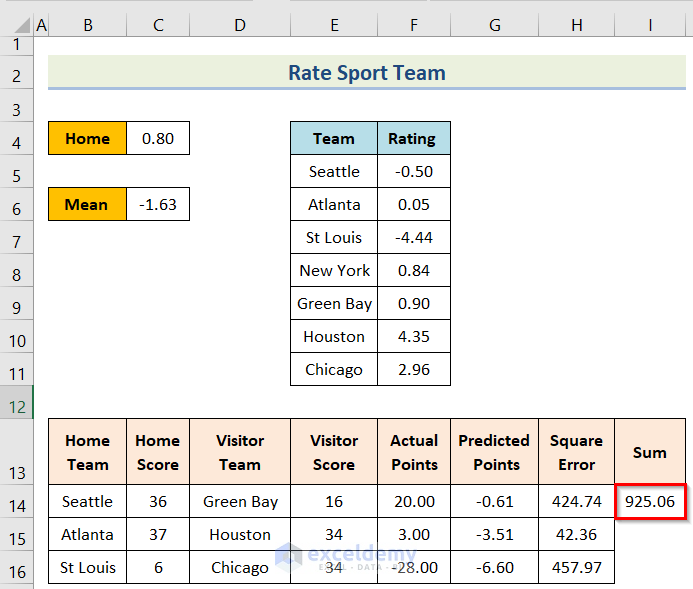
Step 4 – Determine the Final Sum
- Enter the following formula in I14.
=SUM(H14:H16)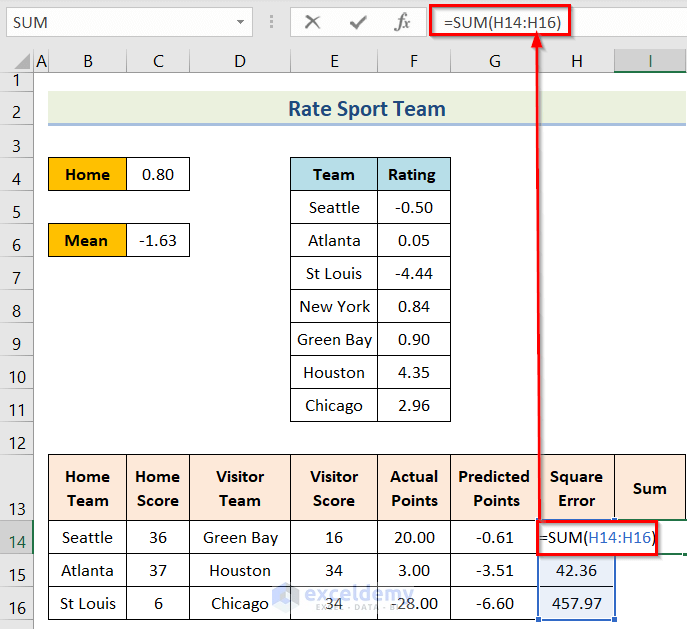
This is the output.
Read More: How to Use Excel Solver for Linear Programming
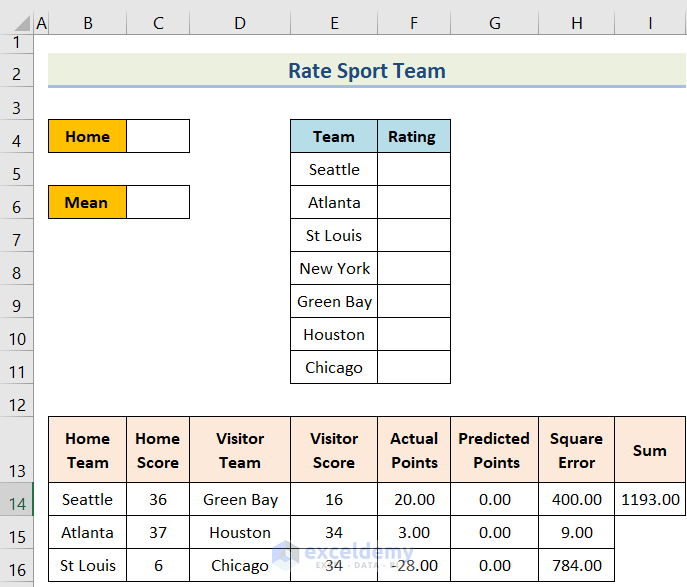
Step 5 – Use the Excel Solver
- Create a dataset to see the team rating.
- Click File.

- Select More…>Options.

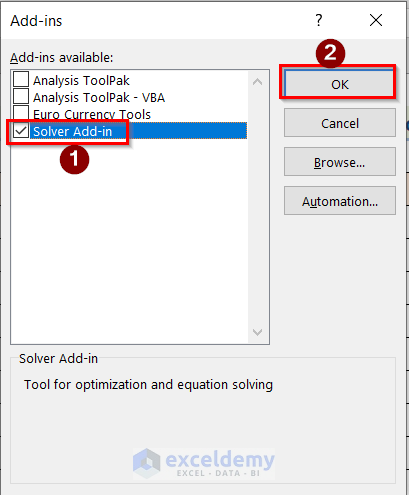
- Choose Add-ins > Solver Add-ins > OK.
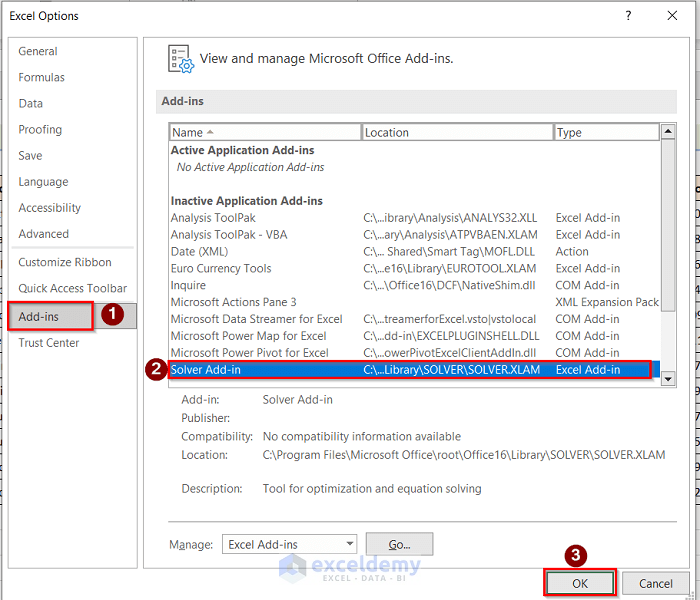
- In the Developer tab, select Excel Add-ins.

- Check Solver Add-in and click OK.
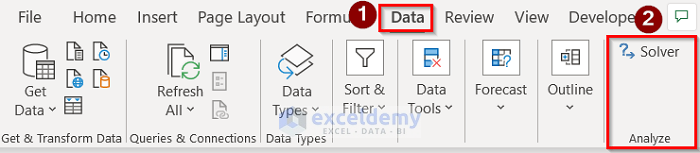
- Go to Data>Solver to open the Solver Parameters dialog box.
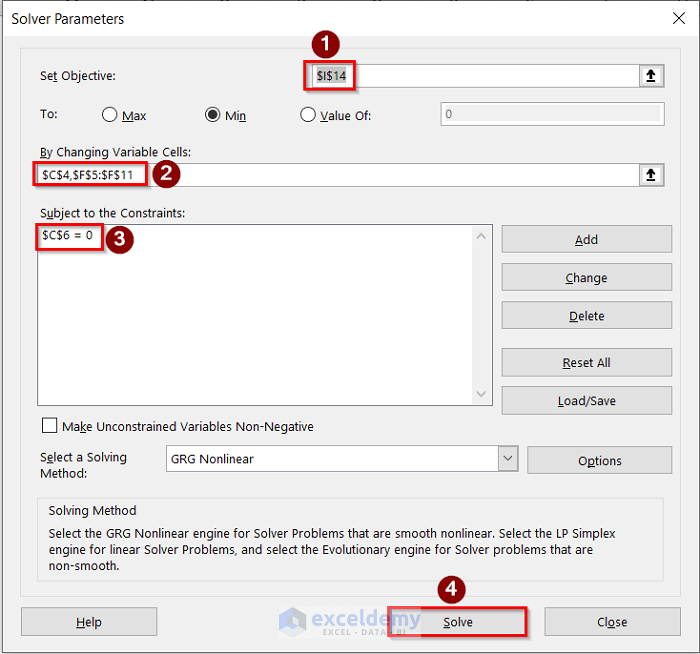
- Enter the target cell in Set Objective, the constraints cell in Subject to the Constraints, and the cells to change in By Changing Variable Cells section.
- Click Solve.
- Click OK.
This is the output.
Read More: Example with Excel Solver to Minimize Cost
Things to Remember
- As the objective is to rate each team. Home-field edge and Team ratings are entered in By Changing Cells.
- To make the prediction as close as possible to the outcome of each game, the sum differences between the Actual outcome and the Predicted outcome are entered in the target cell.
- Positive and negative prediction errors can cancel each other out. If you over-predict the home team margin by 5 points in one game and under-predict it by 5 points in another game, the sum of the two differences will yield a value of 0 when, in fact, you were off by 10 points for a game. To avoid this, add 2 powers of [(Actual Outcome) – (Predicted Outcome)] to all games.
- This model uses GRG Nonlinear in the last step.
Download Practice Workbook
Download the practice workbook.
Related Articles
- How to Use Excel Solver to Determine Which Projects Should Be Undertaken?
- Solving Sequencing Problems Using Excel Solver Solution
- Solving Transportation or Distribution Problems Using Excel Solver
- How to Assign Work Using Evolutionary Solver in Excel
- Resource Allocation in Excel
- Solving Equations in Excel
<< Go Back to Excel Solver Examples | Solver in Excel | Learn Excel
Get FREE Advanced Excel Exercises with Solutions!

Just found this article on GR i am not sure in your explanation when you said seattle has 4 point better than st Louis. Can you please explsin this?
Thank you
Thanks for your question. Here Seattle has a rating of -0.50409…And St Louis Rams has -4.439784. if you subtract -0.50409 from the -4.439784, then you will get 4.943874.which is approximately around 4. So the statement that “Seattle has 4 points better than St Louis”
I think is much better to obtain the average points per game.
Home team vs Opponent team and then to obtain (MOV) Margin of Victory. MOV +/-
Thus this will give you a better point of view which team will win the match.
And or Apply forecast or trend functions at least with the last three seasons.
I know all we have a different way or sistem to predict game scores.
Thanks a lot for your comment, we will take your suggestions into consideration in the future.