Before analyzing how to use scenario manager in Excel to do scenario analysis, it’s important to understand the limitations of one and two variable data tables.
Limitations of data tables
We have discussed one and two-variable data tables in the following articles.
How to create a one-variable data table in Excel (2 Examples)
How to create a two-variable data table in Excel
Data tables are useful, but they have some limitations:
- In data tables, you can vary only one or two input cells at a time.
- Setting up a data table is not very easy.
- A two-input table shows the results of only one formula cell. To get results of more formula cells, we must create additional data tables.
- In certain cases, we’re looking for results of selected combinations not the entire table, where the table will show all possible combinations of two input cells.
Introducing Excel Scenario Manager
The Scenario Manager is an easy way to automate some inputs of our what-if models. We can store different sets of input values (called changing cells in Scenario Manager) for any number of variables and give a name to each set. We can then select a set of values by name, and Excel displays the worksheet by using those values. We can also generate a summary report that displays the effect of various combinations of values on any number of result cells. These summary reports can be in outline or pivot table form.
For example, say you have a company and your company’s annual sales forecast depends upon several factors. You can define three scenarios: best case, worst case, and most likely case. You can then switch to any of these scenarios by selecting the named scenario from a list. Excel will substitute the appropriate input values in your worksheet and recalculate the formulas according to the scenario.
Scenario Analysis Definition
To introduce Excel Scenario Manager, let’s start with a practical example of a simplified production model, as shown in the following figure.
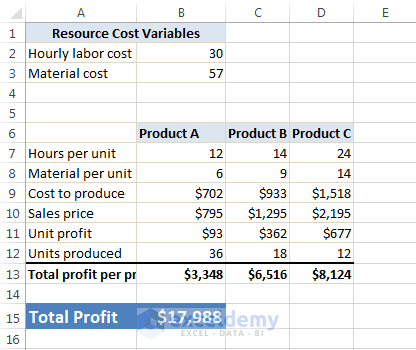
A simple production model used to demonstrate Scenario Manager.
The above worksheet contains two input cells: the hourly labor cost (cell B2) and the per unit material cost (cell B3). The company produces three products, and each product requires a different number of hours and a different amount of materials to produce.
Formulas calculate the total profit per product (row 13) and the total combined profit (cell B15). The company management is trying to predict the total profit, but this is variable when the hourly labor cost and material costs can differ. The company has identified three scenarios listed in the following Table.
| Scenario | Hourly Labor Cost | Material Cost |
|---|---|---|
| Best Case | 30 | 57 |
| Worst Case | 38 | 62 |
| Most Likely | 34 | 59 |
As expected, in the Best Case scenario the company will have the lowest hourly cost and lowest materials cost. The Worst Case scenario will have the highest values for both the Hourly Labor Cost and the Material Cost. The third scenario is the Most Likely case, which will have intermediate values for both Labor Cost and Material Cost. The company managers must be prepared for the worst case, however they will optimize their performance controlling the scenario under the Best Case Scenario.
Step by Step Procedure to do Scenario Analysis
- Choose Data ➪ Data Tools ➪ What-If Analysis ➪ Scenario Manager.
Scenario Manager dialog box will appear. When we first open this dialog box, it shows No Scenarios defined.
- Choose Add to add scenarios.
After we add named scenarios, they will appear in the Scenarios list in the dialog box.
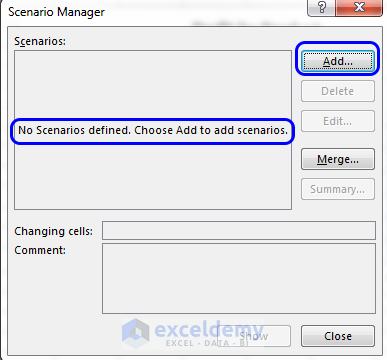
Scenario Manager dialog box, showing that there is no scenario defined. Using the Add button, we can generate a scenario.
Step 1 – Adding a Scenario
- Click the Add button in the Scenario Manager dialog box to add a scenario.
Excel will display the Add Scenario dialog box, shown in the following figure.
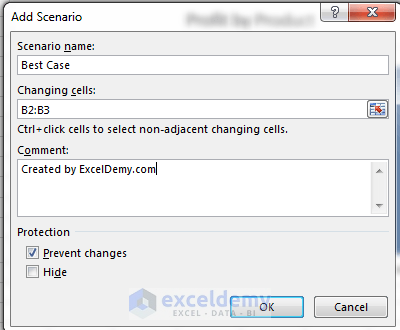
Using the Add Scenario dialog box to create a scenario.
The Add Scenario dialog box consists of four parts:
- Scenario Name: Provide a meaningful name.
- Changing Cells: These are the input cells for the scenario. Enter the cell addresses directly or point to them. If you’ve given names to the cells, enter the names. Nonadjacent cells are allowed for this field. If you are required to point to multiple cells, press the CTRL key on your keyboard while you click on the cells. Every scenario won’t necessarily use the same set of changing cells. A different scenario can use different changing cells. The number of changing cells is not unlimited for a scenario; it is limited to 32.
- Comment: By default, Excel shows the name of the person who created the scenario and the date when it was created. As desired, change this text, add new text to it, or delete it completely.
- Protection: The two Protection options are for preventing changes and hiding a scenario. These options only take effect when you protect the worksheet and choose the Scenario option in the Protect Sheet dialog box. When a scenario is protected, it will prevent anyone from modifying it, while a hidden scenario doesn’t appear in the Scenario Manager dialog box at all.
Read More: How to Create Scenarios in Excel (With Easy Steps)
Step 2 – Adding Values to Scenarios
In our example, we’ll define the three scenarios listed in the above Table. The changing cells are Hourly_Cost (B2) and Materials_Cost (B3).
For example, enter the following information in the Add Scenario dialog box to enter the Best Case Scenario:
- Enter “Best Case” in the Scenario name field.
- Select both B2 and B3 cells pressing CTRL to enter the values in the Changing cells field.
- Edit “Created by ExcelDemy.com on 20/01/2014” in the Comment box. By default, Prevent Changes is check-marked under the Protection option.
- After entering the information in the Add Scenario dialog box, click OK.
Excel will display the Scenario Values dialog box, shown in the figure below. This dialog box displays every field we’ve entered into the changing cells specified in the previous dialog box.
- Enter the values for each cell in the scenario.
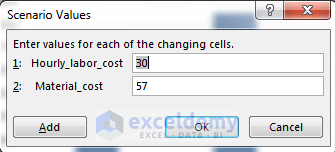
We entered the values for the scenario in the Scenario Values dialog box.
- As we have more scenarios to add, click the Add button again.
- When done with entering all the scenarios, click OK to return to the Scenario Manager dialog box, which now displays our entered scenarios in its list.
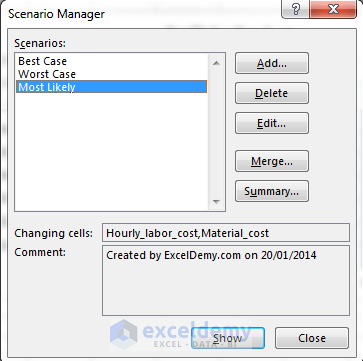
Displaying Scenario list.
Step 3 – Displaying Scenarios
- Select one of the listed scenarios and click the Show button (or double-click the Scenario name) to display the results of the scenario.
Excel inserts the corresponding values into the changing cells and the results of that scenario are shown in the worksheet. The following two figures show the example of selecting two scenarios (Best Case and Worst Case).
Best Case Scenario
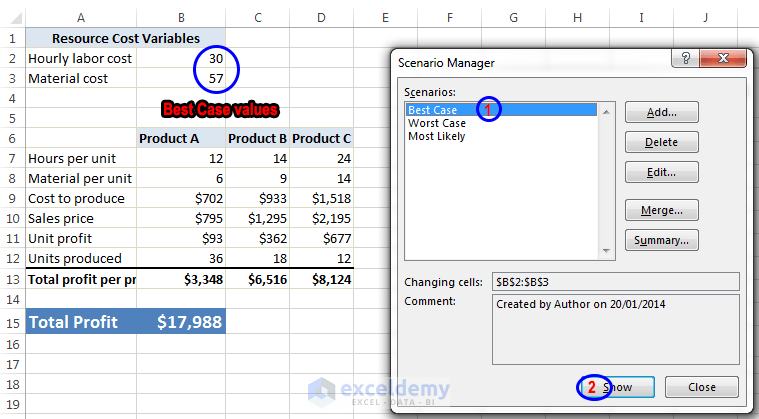
Best Case Scenario Selected
Worst Case Scenario
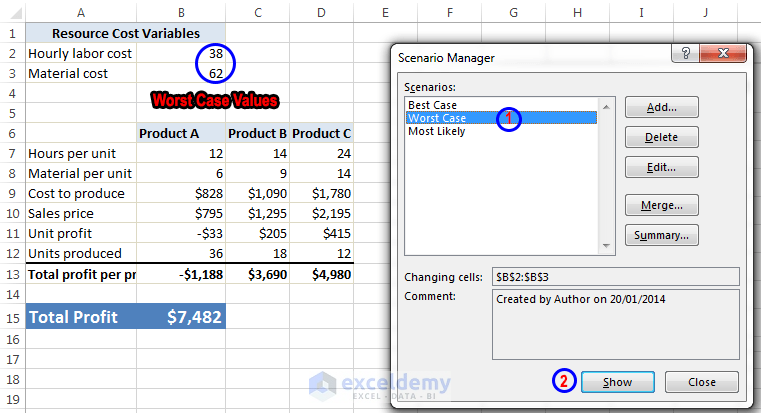
Worst Case Scenario Selected.
Step 4 – Modifying Scenarios
It is possible to modify the scenarios after we’ve created them.
- From the Scenarios list, select the scenario that you want to change and click the Edit button.
The Edit Scenario dialog box will appear.
- Change whatever you need in the Edit Scenario dialog box, such as the name of the scenario and/or the Changing Cells field.
- When done, click OK.
The Scenario Values dialog box will appear.
- Make your changes in the Scenario Values dialog box and then click OK to return to the Scenario Manager dialog box.
Excel automatically updates the Comments box with new text that shows when the scenario was modified.
Step 5 – Merging Scenarios
The company may have several people working on a spreadsheet model, and several people may have defined various scenarios. For example, the marketing department may have its opinion of what the input cells should be, the finance department may have another opinion, and the company CEO may have another entirely.
Excel makes it easy to merge these various scenarios in a single workbook. Before you merge scenarios, make sure that the workbook from which we’re merging is open.
- Click the Merge button in the Scenario Manager dialog box.
The Merge Scenarios dialog box will appear.
- Choose the workbook from where you want to add the scenarios from the Book drop-down list.
- Choose the sheet that contains the scenarios you want to merge from the Sheet list box.
The dialog box displays the number of scenarios in each sheet as you scroll through the Sheet list box.
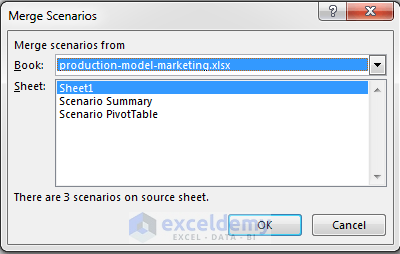
production-model-marketing workbook’s Sheet1 worksheet contains 3 scenarios. Click OK to select these 3 scenarios to merge with the existing workbook.
- Click OK to return to the previous dialog box, which now displays the scenario names that you merged from the other workbook.
Step 6 – Generating Scenario Summary Report
If you’ve created multiple scenarios, you may want to document your work by creating a scenario summary report. When you click the Summary button in the Scenario Manager dialog box, Excel displays the Scenario Summary dialog box.
You have two choices to create a report:
- Scenario Summary: Appears in the form of a worksheet outline.
- Scenario PivotTable: Appears in the form of a pivot table.
For simple cases of scenario management, a standard Scenario Summary report is usually sufficient. If you have many scenarios defined with multiple result cells, you may find that a Scenario PivotTable provides more flexibility.
The Scenario Summary dialog box also asks you to define the result cells (the cells that contain the formulas in which you’re interested). For this example, we select B13: D13 and B15 (multiple selections) to make the report show the profit for each product, plus the total profit.
Note: The main limitation of Scenario Manager is that a scenario can use no more than 32 changing cells. If you attempt to use more cells, you will get an error message.
Excel automatically creates a new worksheet to store the summary table. The following two figures show the Scenario Summary and Scenario PivotTable forms of the report. If you’ve given names to the changing cells and result cells, the table uses these names; otherwise, it lists the cell references.
Scenario Summary Report
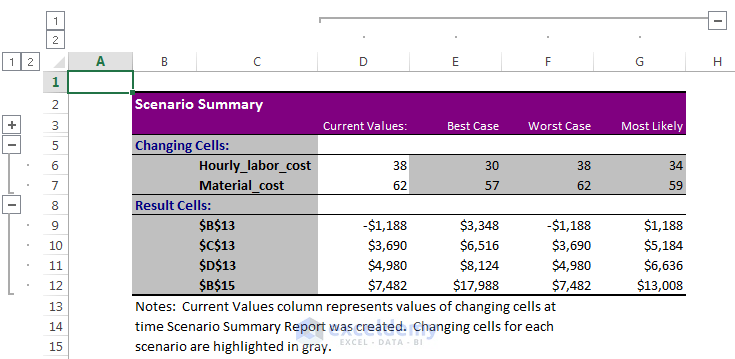
Scenario Summary report
Scenario PivotTable Report
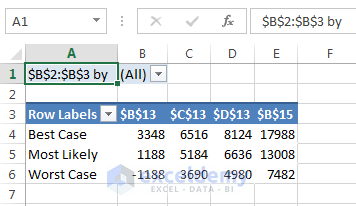
Scenario PivotTable report
Read More: How to Do What-If Analysis Using Scenario Manager in Excel


Thanks for this article, Excel Tip for IT and business integration.
You’re most welcome Michael 🙂
Thanks for the article, where can I download the sample file?
In the Download Section, you will get the Workbook: production-model-scenarios.xlsx.
please let me know if in the summary report we can define the name of the result cells. It is not meaningful to just show the cell references such as B13, C13, etc as result cells. Rather it would be great if we can define the report as profit of product a, b , etc.
Rajesh,
If you’ve given names to the changing cells and result cells, the table uses these names; otherwise, it lists the cell references. Just use some names for the cell references B13, C13, D13 and B15 in the Sheet1 Worksheet in the provided Workbook. Then create the Summary Report again. You will get the result cells using some names.
Thanks for the article
Is there a way, using VBA perhaps that, when I change values in changing cells in the worksheet, it will automatically update the scenario without having to open up scenario manager?
I will update you.
Best regards
Kawser