What Is a One Way/Variable Data Table?
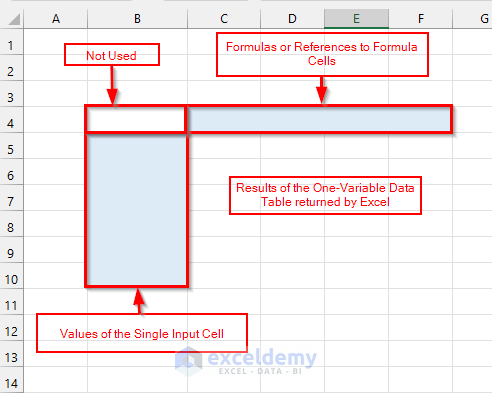
In a one-variable data table, a single cell is the input in the data table. The following figure shows the general layout for a one-variable data table. You have to create this layout manually.
How to Create a One-Variable Data Table in Excel: 2 Examples
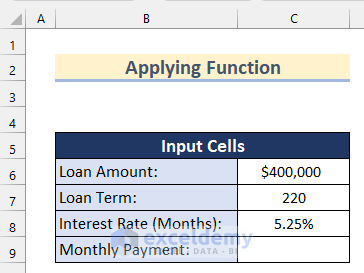
Example 1 – Applying a Function to Create a One-Variable Data Table in Excel
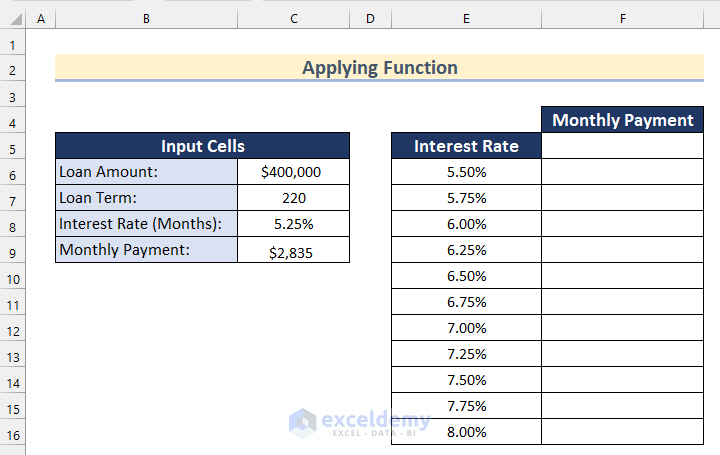
We have a dataset containing the values of Loan Amount, Loan Term, and Interest Rate (Months). We will calculate the Monthly Payment using a function and create a one variable data table in Excel.
Step 1 – Calculating the Monthly Payment
The PMT function is used to calculate the periodic payment with a specific interest rate.
- Select cell C9.
- Insert the following formula.
=PMT(C8/12,C7,-C6)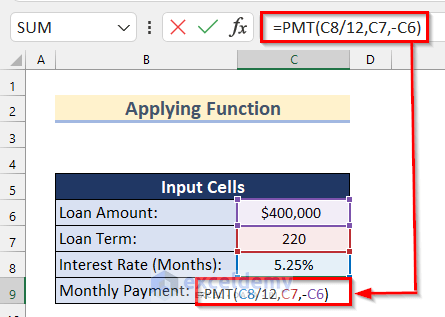
In the PMT function, we inserted cell C8 as the rate and divided it by 12 (1 year = 12 months) as the equation is for monthly payment. We inserted cell C7 as nper and the negative value of cell C6 as pv.
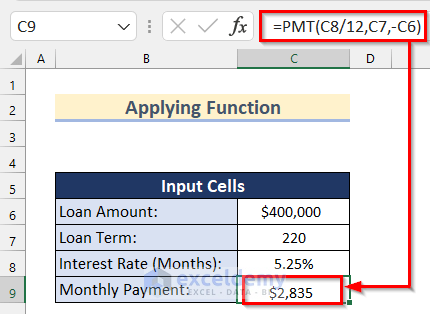
- Press Enter to get the value of the Monthly Payment.
Step 2 – Setting Up a One-Variable Data Table in Excel
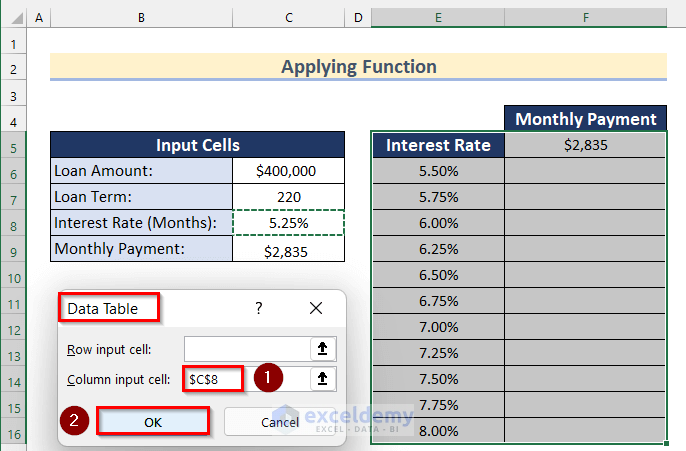
- We created the Interest Rate column for the data table in column E with interest rates from 5.50% to 8.00%. These interest rates will create our data table using the What-If Analysis feature.
- We added the Monthly Payment column for the data table in column F.
- Select cell F5.
- Insert the following formula:
=C9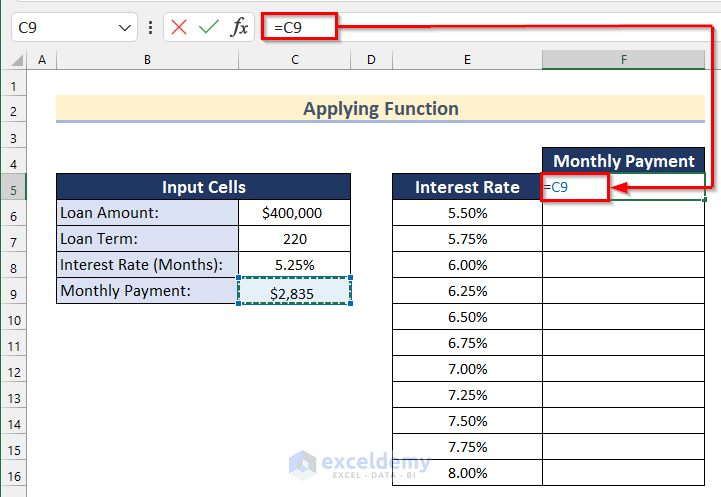
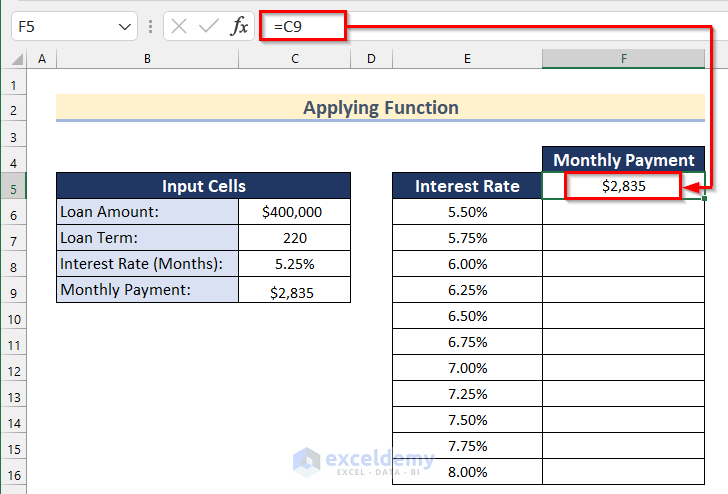
We inserted the value of cell C9, which represents the value of the Monthly Payment for a 5.25% interest rate in cell F5.
- Press Enter.
Step 3 – Using the What-If Analysis Feature
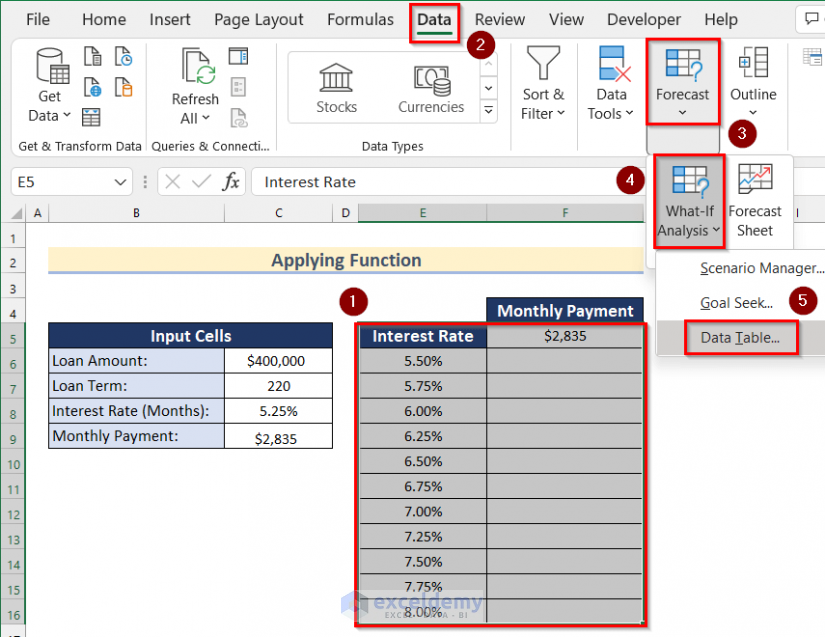
- Select the range E5:F16.
- Go to the Data tab.
- Click on Forecast.
- Click on What-If Analysis.
- Select Data Table.
The Data Table box will appear.
- Insert cell C8 as the Column input cell.
- Press OK.
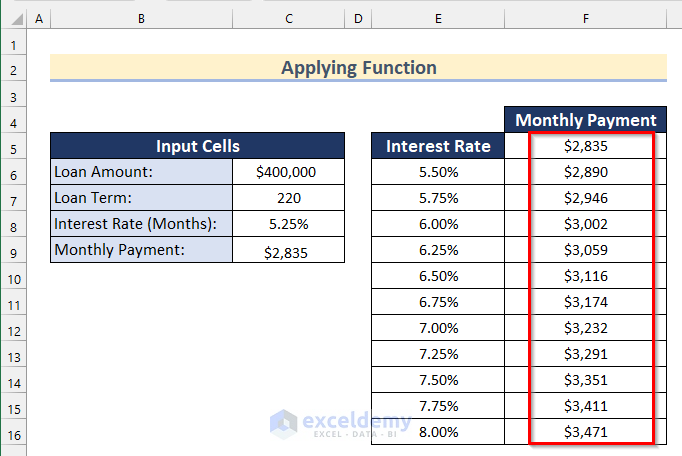
- The Monthly Payments have been automatically calculated using the function in cell C9 with respect to the interest rate provided in column E.
Read More: How to Create One Variable Data Table Using What-If Analysis
Example 2 – Using a Generic Formula to Create a One-Variable Data Table in Excel
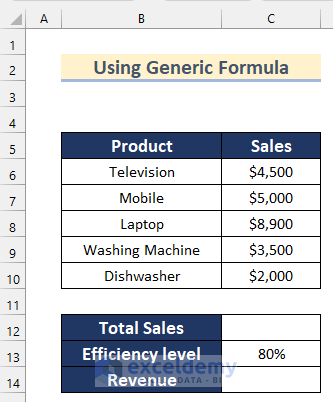
We have a dataset containing the Sales values of some Products and the value of Efficiency level. We will calculate the Revenue using a generic formula and create a one-variable data table in Excel.
Step 1 – Calculating the Revenue
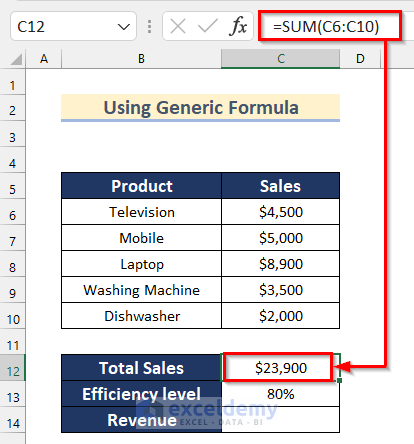
- Select cell C12.
- Insert the following formula.
=SUM(C6:C10)
- Press Enter to get the value of Total Sales.
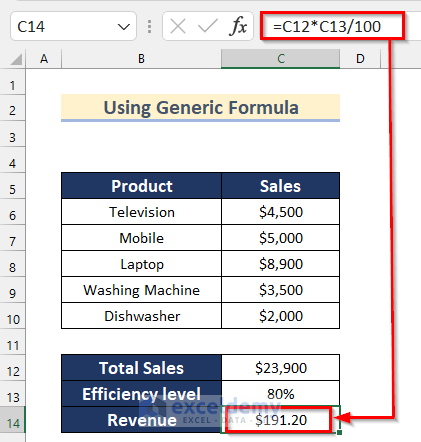
- Select cell C14.
- Insert the following formula.
=C12*C13/100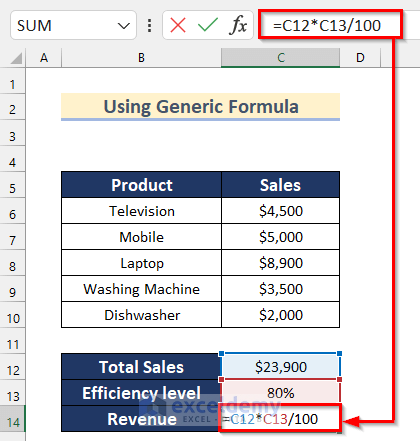
- Press Enter to get the value of Revenue.
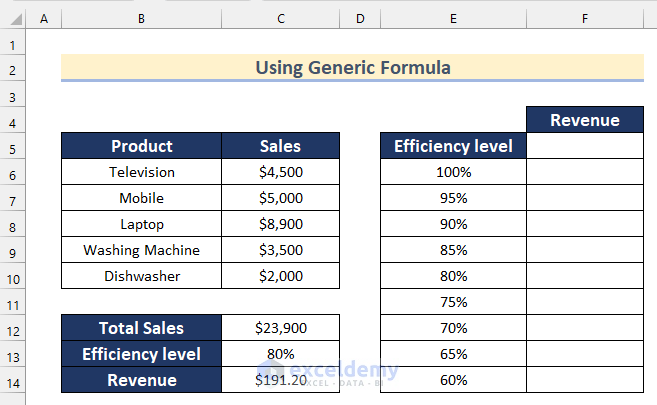
Step 2 – Setting Up a One-Variable Data Table
- We created the Efficiency level column for the data table in column E with an efficiency level from 100% to 60%. These Efficiency levels will create our data table using the What-If Analysis feature.
- We added the Revenue column for the data table in column F.
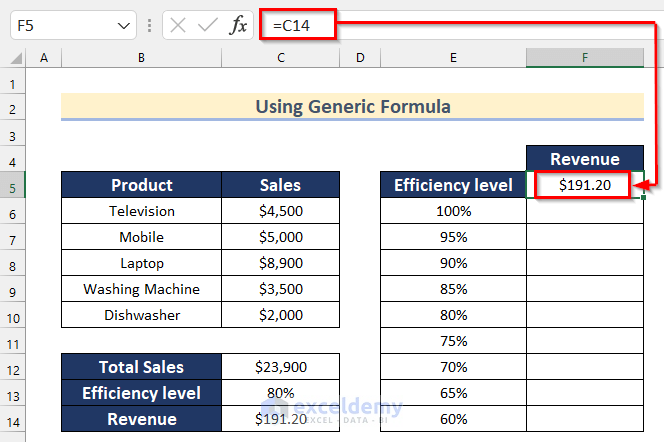
- Select cell F5.
- Insert the following formula.
=C14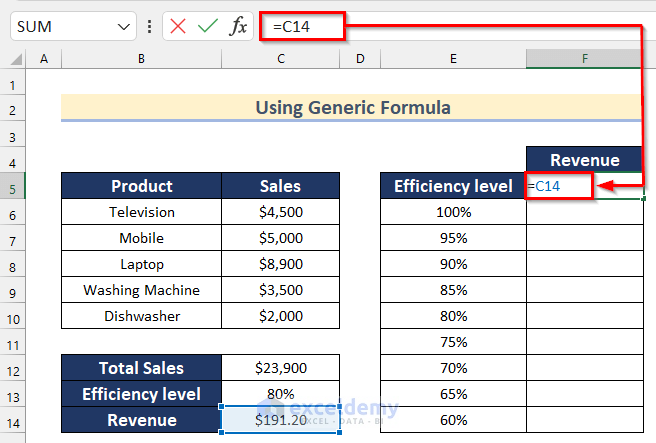
We inserted the value of cell C14 which represents the value of Revenue for an 80% Efficiency level in cell F5.
- Press Enter.
Step 3 – Using the What-If Analysis Feature
- Select the range E5:F14.
- Go to the Data tab.
- Click on Forecast.
- Click on What-If Analysis.
- Select Data Table.
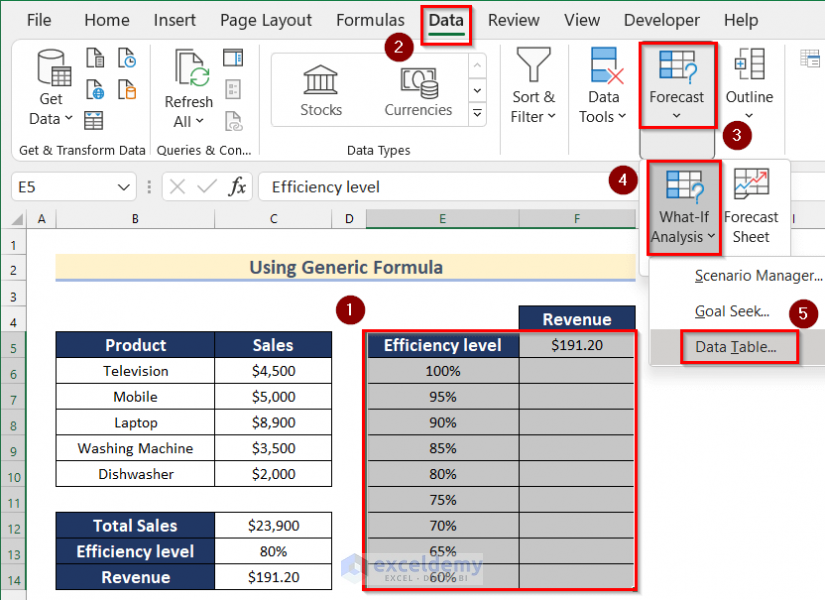
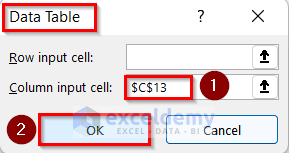
- The Data Table box will appear.
- Insert cell C13 as the Column input cell and press OK.
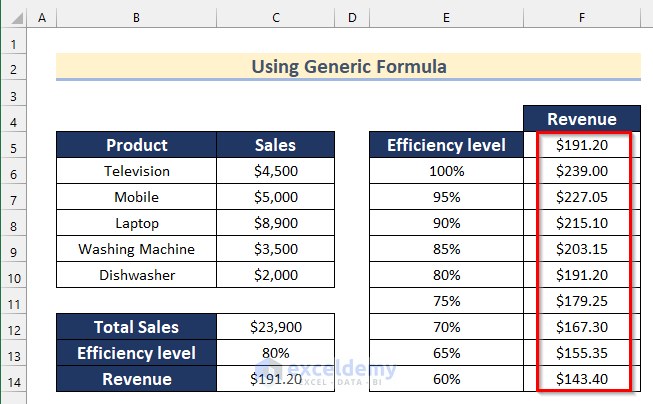
- You will see that the revenue has been automatically calculated using the generic formula in cell C14 with respect to the efficiency levels provided in column E.
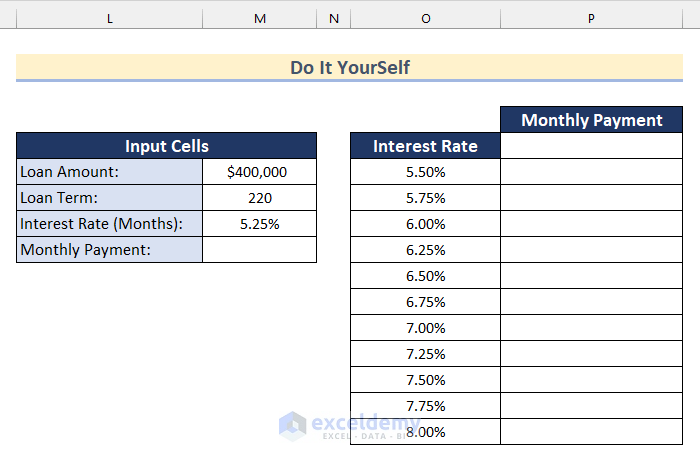
Practice Section
In this section, we are giving you the dataset to practice on your own.
Download the Practice Workbook
<< Go Back to Data Table in Excel | What-If Analysis in Excel | Learn Excel
Get FREE Advanced Excel Exercises with Solutions!

Thanks for sharing, this is a fantastic blog post.Really looking forward to read more. Great.
Thanks a lot for your compliments, Raul. Glad to hear that the article came in handy for you
HOW ABOUT”PROBABILITY” FOR DOIN RACES (DOGS, HORSES,JAI ALAI) ANY INSIGHT AS HOW TO DO THIS WOULD BE GREATLY APPRECIATED. I AM NO COMPUTER GURU
Hi Gerald,
You can create certain data tables consisting of probability. Provide us with more details, we will be able to help with the detailed procedures.