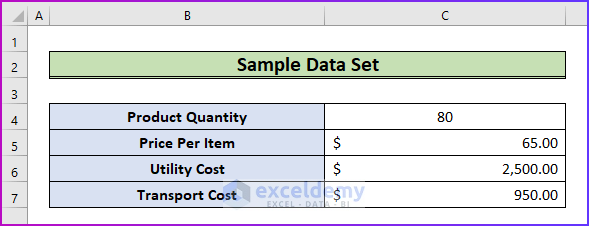
Sensitivity analysis evaluates how various values of an independent variable impact a specific dependent variable. We will apply this to the sample data set below.
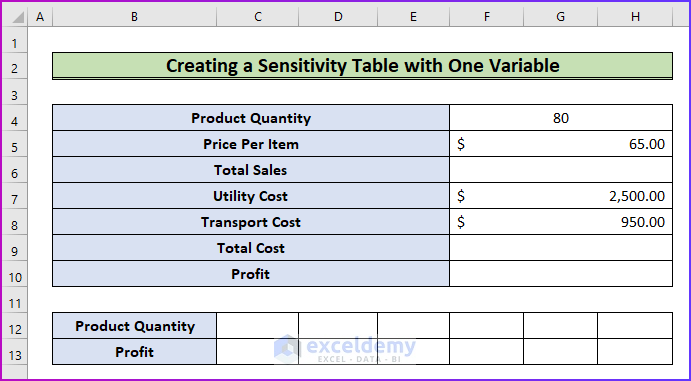
Method 1 – Create a Sensitivity Table with One Variable
Steps:
- Make three extra fields in the primary data set to calculate the total sales, total cost, and profit.
- To calculate the total cost insert the following formula in cell F6 and press Enter to get the value.
=F4*F5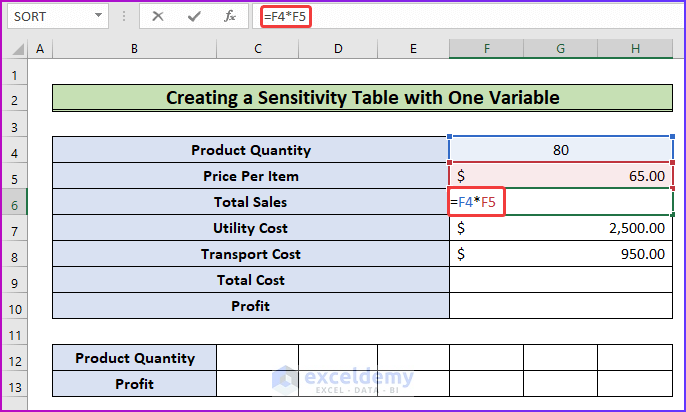
- To find the total cost, add the utility cost and the transport cost together.
- To do this, in cell F9 type the following formula and hit Enter.
=F7+F8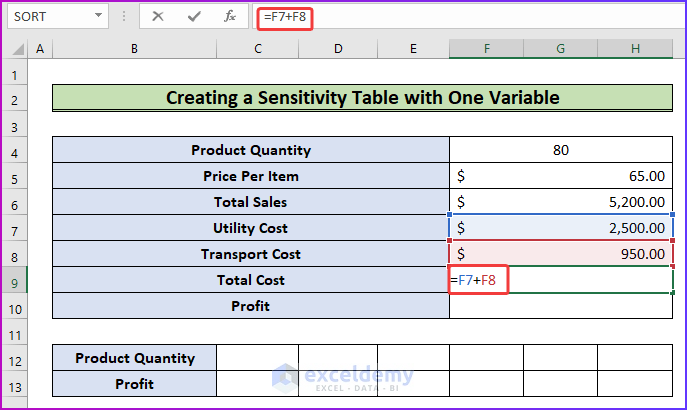
- Determine the profit by entering the following formula in cell F10.
- Press Enter.
=F6-F9 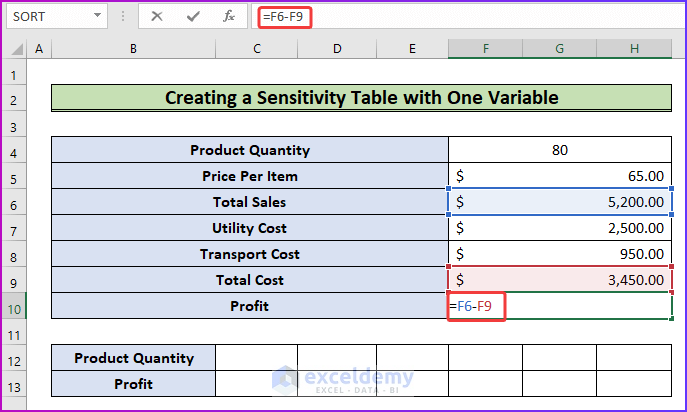
- In cell C13 of the sensitivity table, insert =F10 as in the following image.
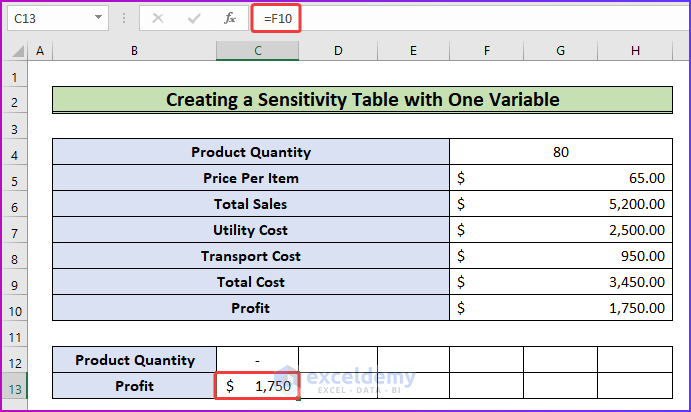
- In the product quantity row, input the amount of product.
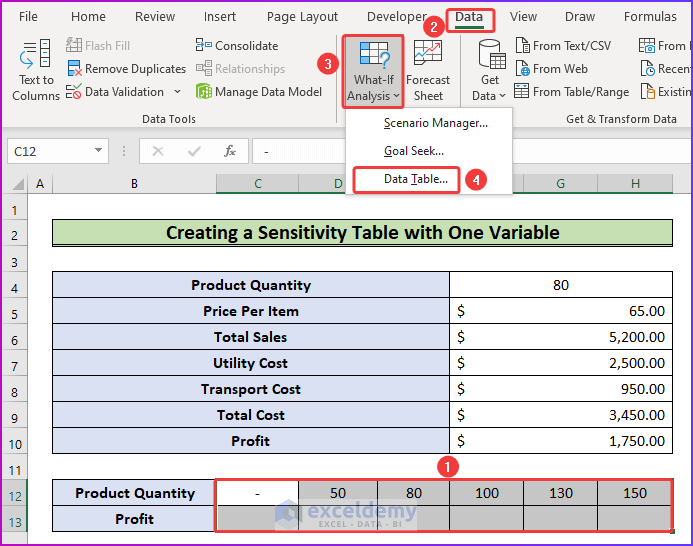
- Select range C12:H13 and go to the Data tab of the ribbon.
- From the What-If Analysis dropdown, choose Data Table.
- In the Row input cell box, select cell F4, to create a data table based on product quantity.
- Press OK.
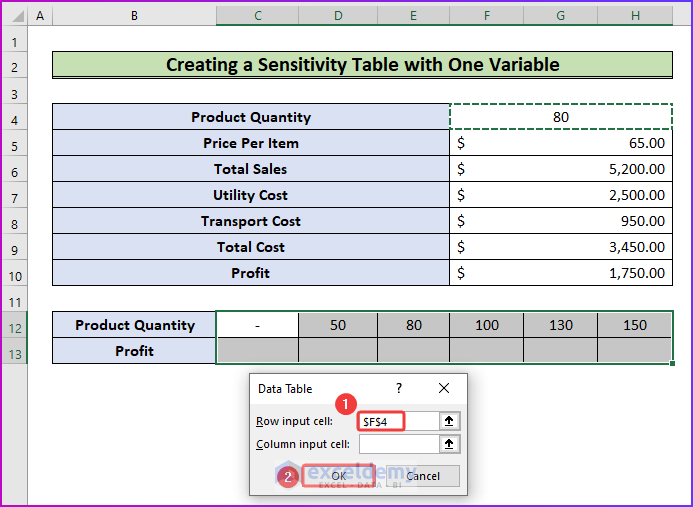
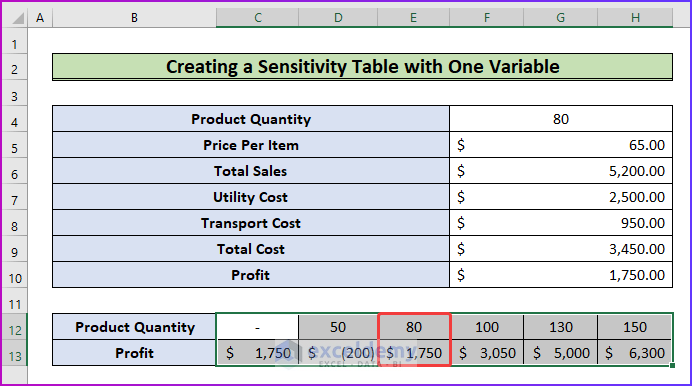
- The sensitivity table displays estimated profits for selling different quantities of a single product.
Method 2 – Create a Sensitivity Table with Two Variables
Steps:
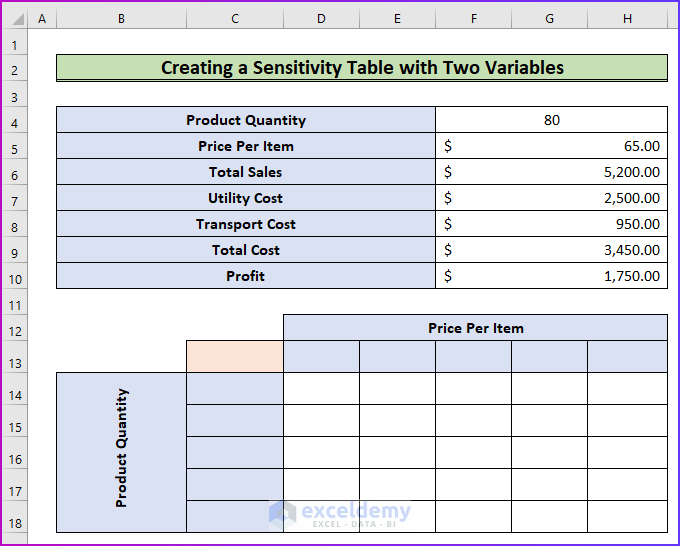
- Create an additional table under the primary data set.
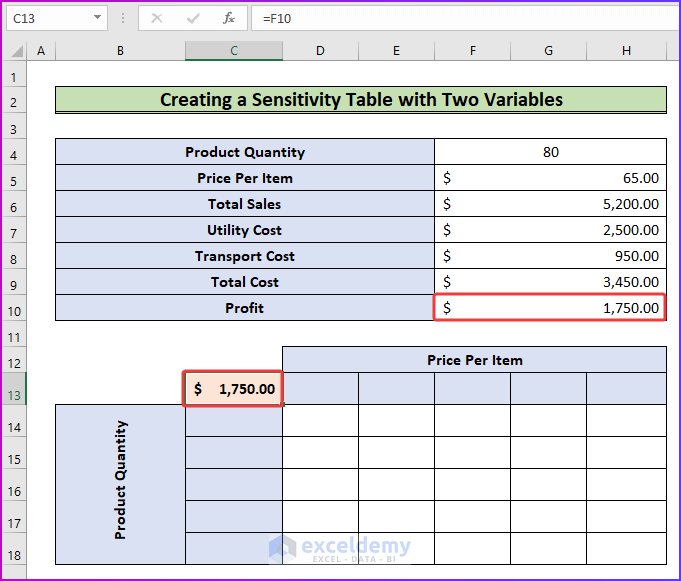
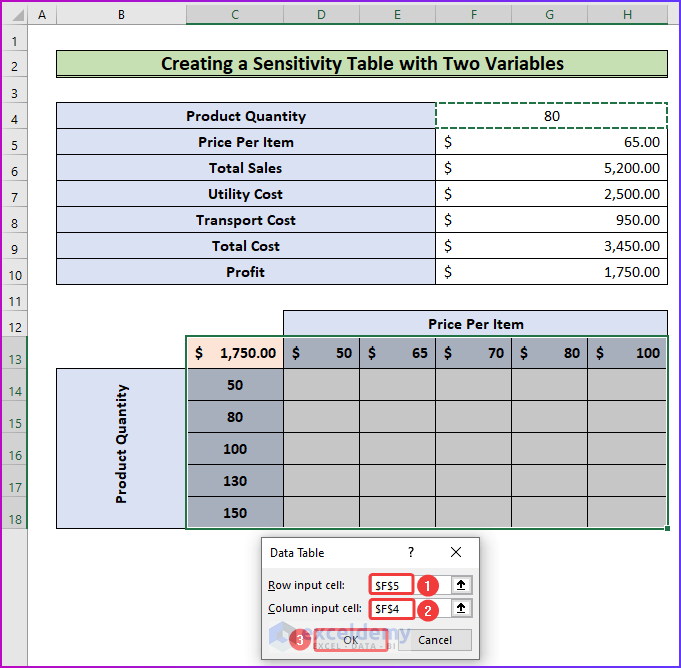
- In cell C13, insert the same cell value as cell F10 as in the following image.
- Choose Data Table from What-If Analysis after selecting the range C13:H18 as in the picture given below.
- Input the values of both chosen variables.
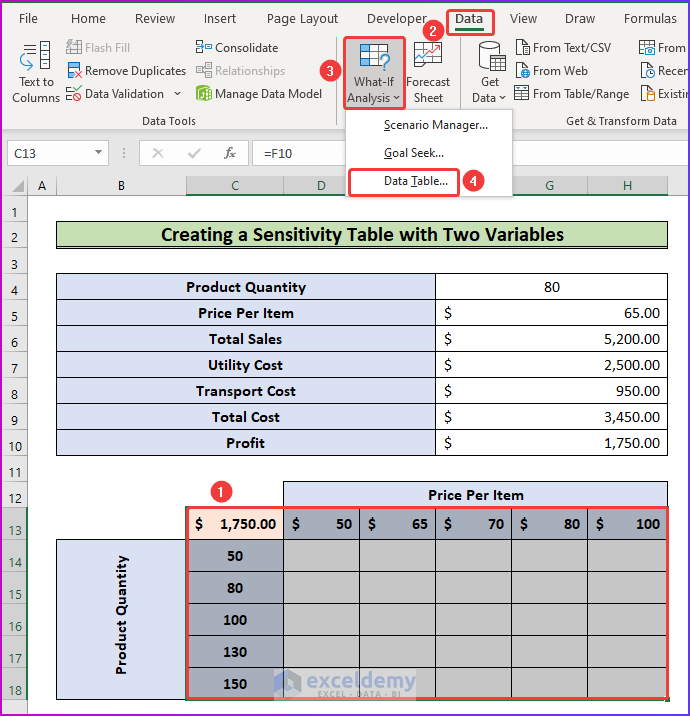
- In the Row input cell box select cell F5.
- In the Column input cell box select cell F4.
- Press OK.
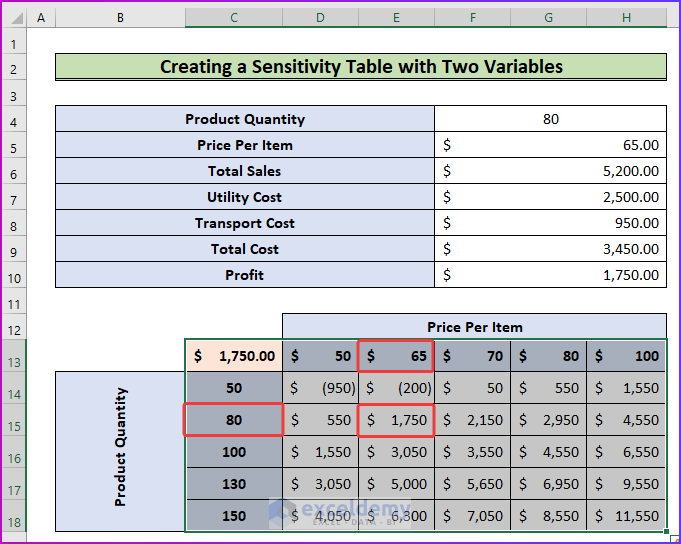
- The sensitivity table has been filled with various values of profit.
- This indicates how much profit can be earned in terms of each product quantity and price per unit.
Read More: How to Create a Two-Variable Data Table in Excel
Related Articles
- One and Two Variables Sensitivity Analysis in Excel
- Data Table Not Working in Excel
- [Fixed] Excel Data Table Input Cell Reference Is Not Valid
<< Go Back to Data Table in Excel | What-If Analysis in Excel | Learn Excel
Get FREE Advanced Excel Exercises with Solutions!
