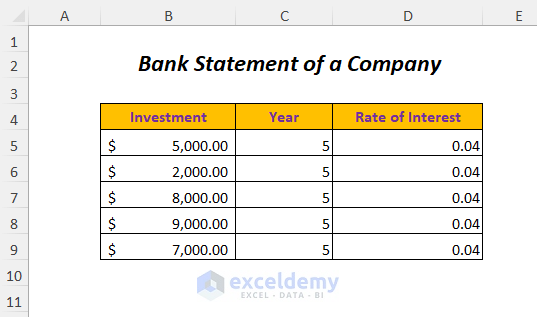
We’ll use the following table to demonstrate creating a data table in Excel.
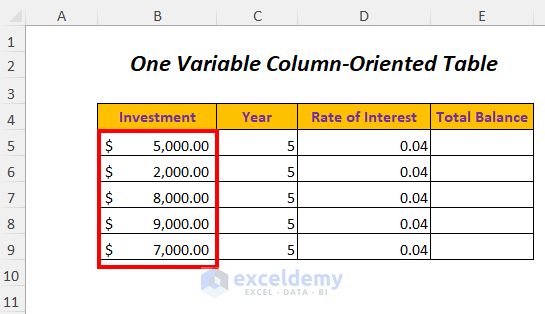
Method 1 – Creating a One-Variable Column-Oriented Data Table
We will use one variable, Investment, for creating a data table and getting the output Total Balance easily with the help of this table.
Steps:
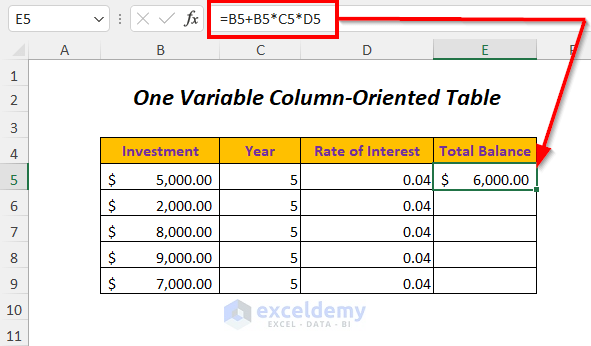
- Get the Total Balance in cell E5 by using the following formula.
= B5+B5*C5*D5Here, B5 is the Investment, C5 is the Year and D5 is the Rate of Interest.
- B5*C5*D5 becomes 5000*5*0.04
Output→ $1,000.00
- B5+B5*C5*D5 becomes 5000+1000
Output→ $6,000.00
- Select the range B5:E9.
- Go to the Data tab.
- In the Forecast group, select the What-If Analysis drop-down and choose the Data Table option.
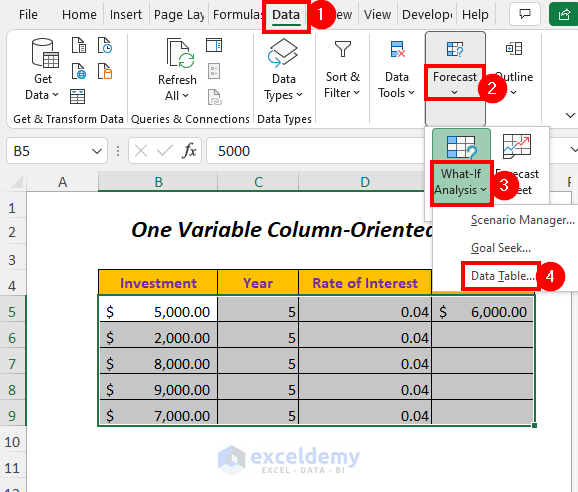
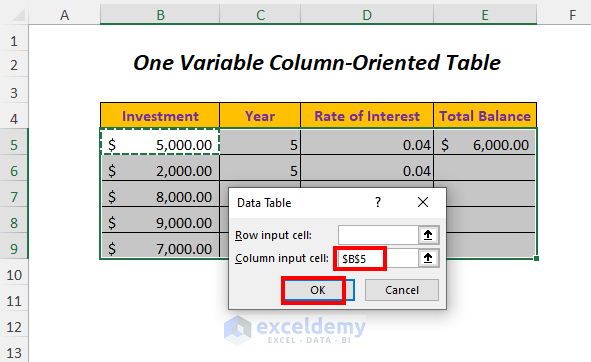
A Data Table dialog box will appear.
- Select the first cell of the Investment column (as you have used this value as a variable for getting Total Balance) as the Column input cell option.
- Press OK.
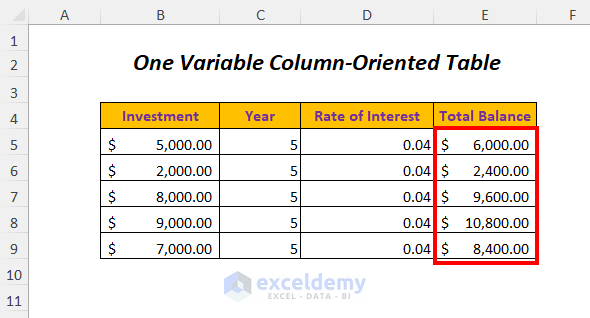
Result:
You will get the Total Balance values for different Investments.
Read more: How to Create One Variable Data Table in Excel
Method 2 – Creating a One-Variable Row-Oriented Data Table
You can use a row variable, Investment, for creating a data table and having the output Total Balance easily with the help of this table.
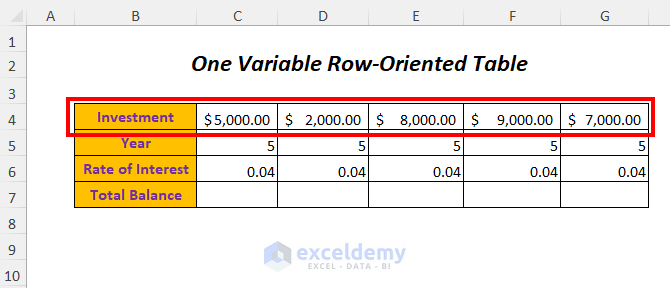
Steps:
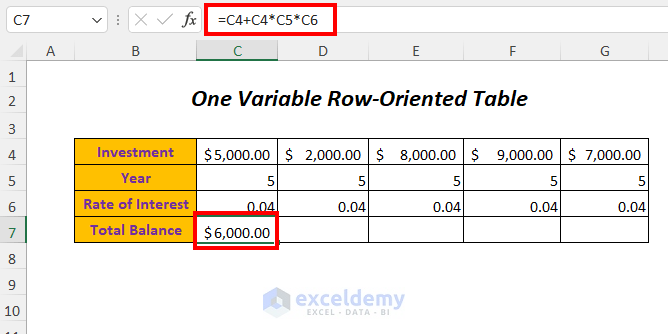
- Use the following formula to get the total balance in cell C7.
=C4+C4*C5*C6Here, C4 is the Investment, C5 is the Year and C6 is the Rate of Interest.
- C4*C5*C6 becomes 5000*5*0.04
Output→ $1,000.00
- C4+C4*C5*C6 becomes 5000+1000
Output→ $6,000.00
- Select the range C4:G7.
- Go to the Data tab and the Forecast group.
- From the What-If Analysis drop-down, select the Data Table option.
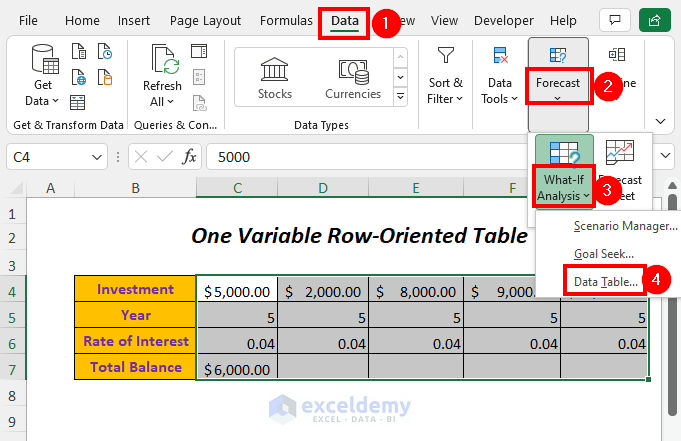
A Data Table dialog box will appear.
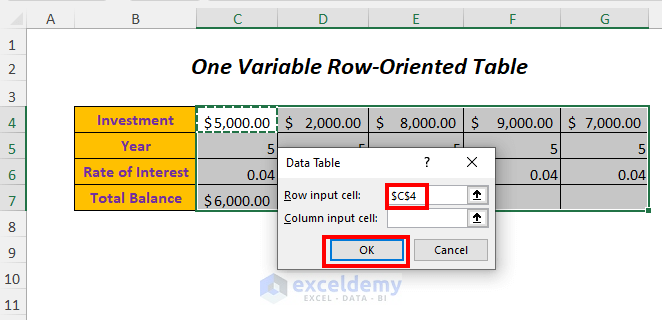
- Select the first cell of the Investment row (as you have used this value as a variable for getting Total Balance) as the Row input cell option.
- Press OK.
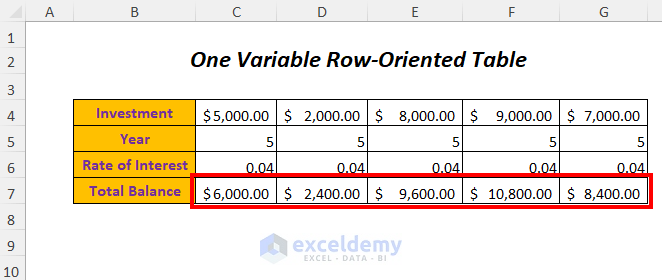
Result:
You will get the Total Balance values for different Investments.
Read More: How to Create One Variable Data Table Using What-If Analysis
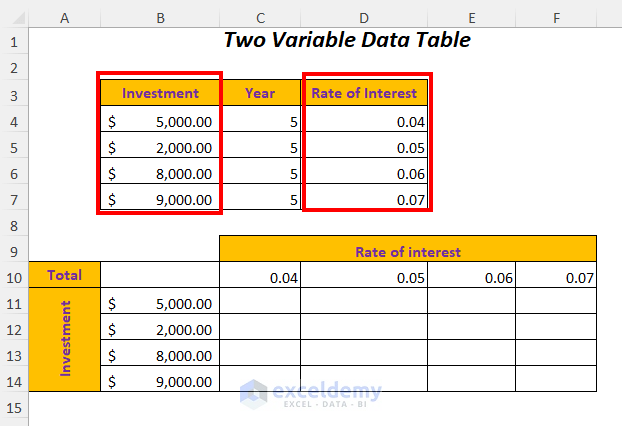
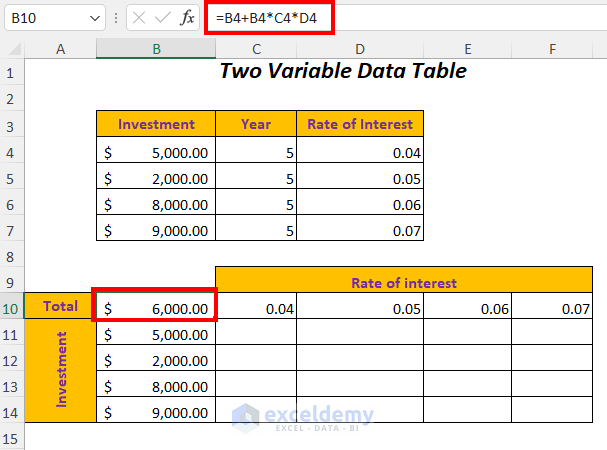
Method 3 – Creating a Two-Variable Row-Oriented and Column-Oriented Data Table
We will create a data table for two variables like Investment and Rate of Interest (we have changed the values in the Rate of Interest column for this method), and for the changes of these two variables, we will see the changes in the total value.
We made an outline where the Rate of interest values are arranged row-wise and Investments are arranged column-wise. We will get the value of the Total Balances in the blank cells using these two variables.
Steps:
- Use the following formula to get the total balance in cell B10.
=B4+B4*C4*D4Here, B4 is the Investment, C4 is the Year and D4 is the Rate of Interest.
- B4*C4*D4 becomes 5000*5*0.04
Output→ $1,000.00
- B4+B4*C4*D4 becomes 5000+1000
Output→ $6,000.00
- Select the range B10:F14.
- Go to the Data tab and the Forecast group.
- From the What-If Analysis drop-down, select the Data Table option.
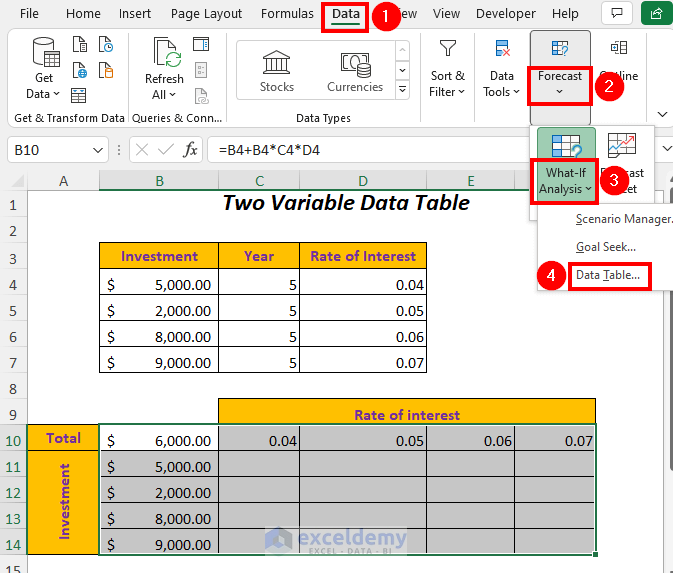
A Data Table dialog box will appear.
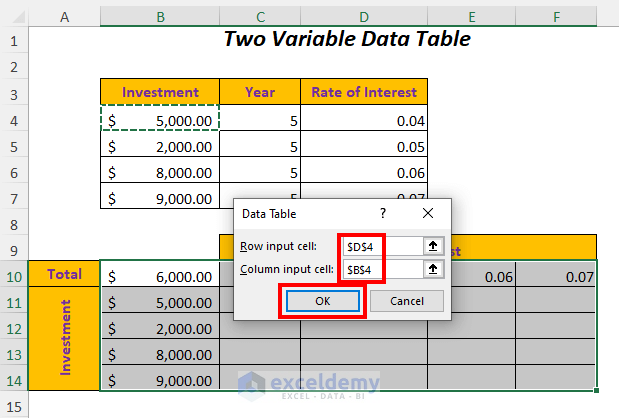
- Select the first cell of the Rate of Interest column (as you have used this value as a variable for getting Total Balance) as the Row input cell option (the values of Rate of Interest are in the row-wise direction) and choose the first cell of the Investment column as the Column input cell option (the values of Investment are in the column-wise direction).
- Press OK.
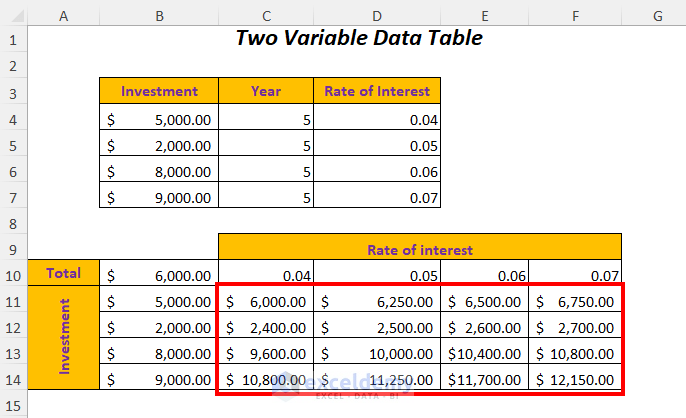
Result:
You will get the Total Balance values for different Investments and Rates of interest.
Read More: How to Create a 4-Variable Data Table in Excel
Method 4 – Multiple Results in a Data Table
You can get multiple results like the values of the Total Balance and Interest for different Investments at once by using a data table.
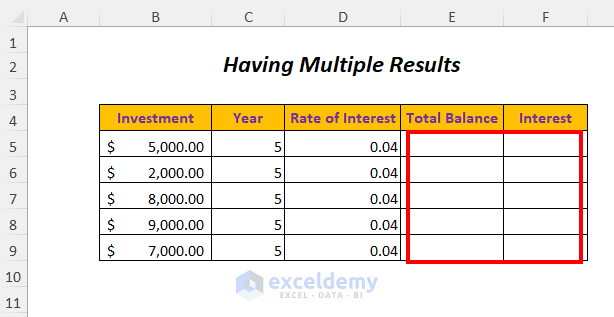
Steps:
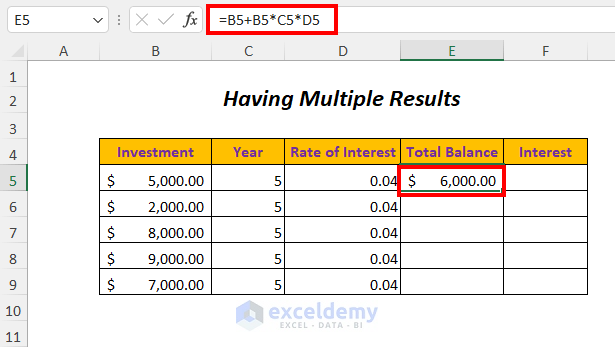
- Use the following formula to get the total balance in cell E5.
=B5+B5*C5*D5Here, B5 is the Investment, C5 is the Year and D5 is the Rate of Interest
- B5*C5*D5 becomes 5000*5*0.04
Output→ $1,000.00
- B5+B5*C5*D5 becomes 5000+1000
Output→ $6,000.00
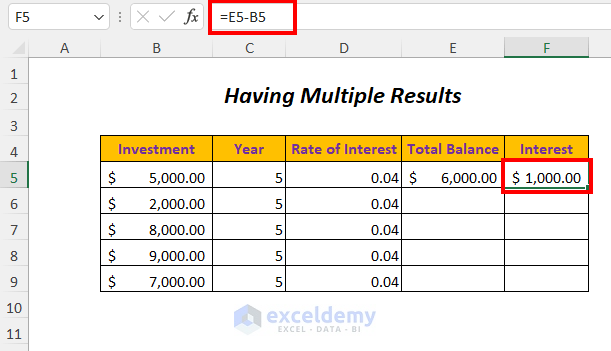
- For the value of Interest in cell F5, use the following formula.
=E5-B5Here, E5 is the Total Balance, B5 is the Investment.
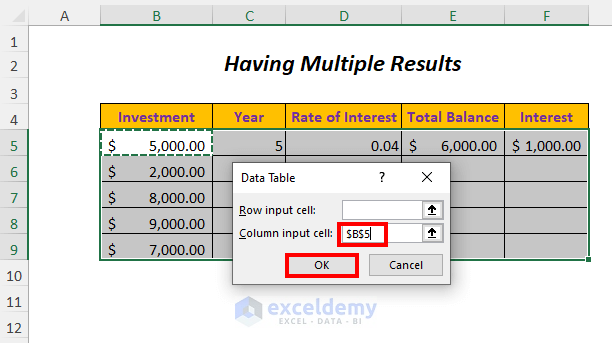
- Select the range B5:F9.
- Go to the Data tab and the Forecast group.
- From the What-If Analysis drop-down, select the Data Table option.
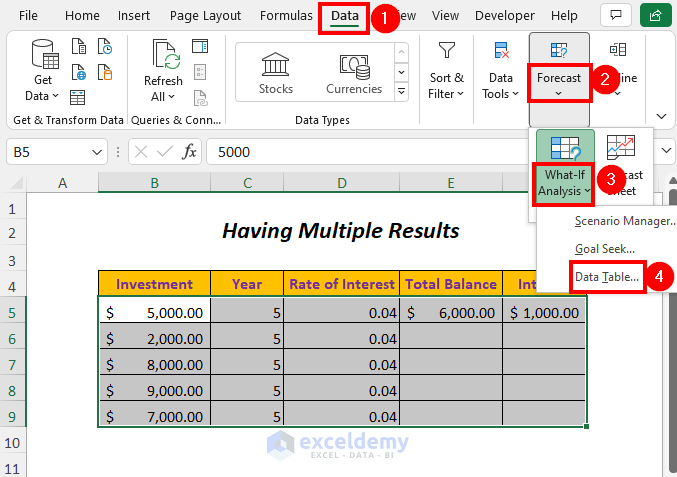
A Data Table dialog box will appear.
- Select the first cell of the Investment column (as we have used this value as a variable for getting Total Balance) as the Column input cell option.
- Press OK.
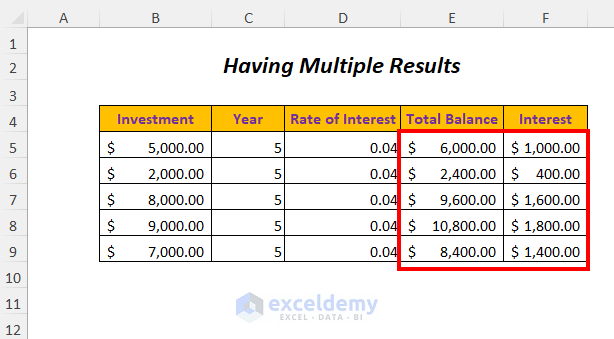
Result:
You will get the Total Balance and Interest values for different Investments and Rates of interest.
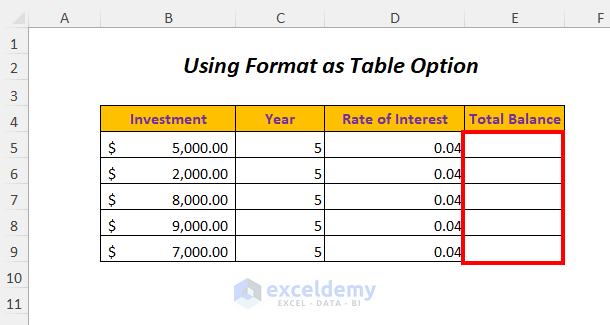
Method 5 – Using the Format as Table Option to Create a Data Table in Excel
We will create a table using the Format as Table option.
Steps:
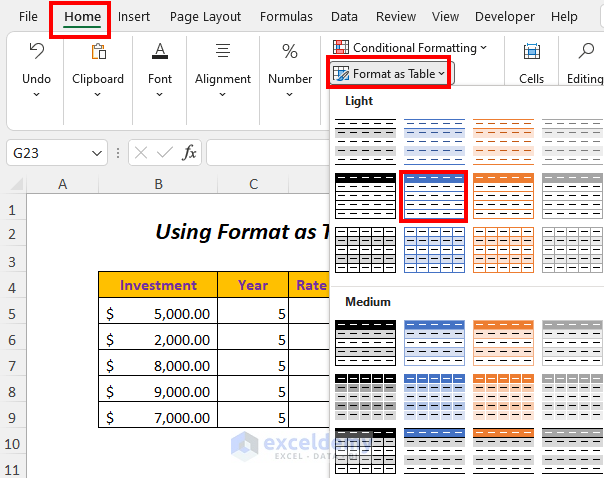
- Go to the Home tab.
- Select the Format as Table option.
- Choose your preferred style.
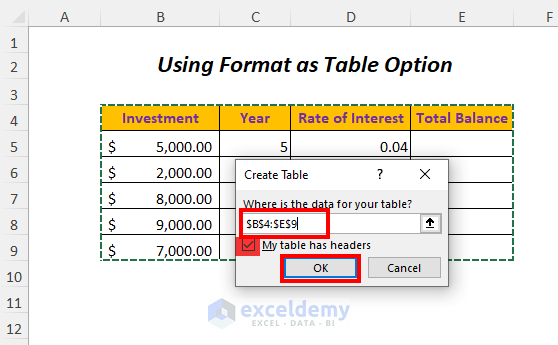
Then Create Table dialog box will appear.
- Select the data range.
- Check the My table has headers option.
- Press OK.
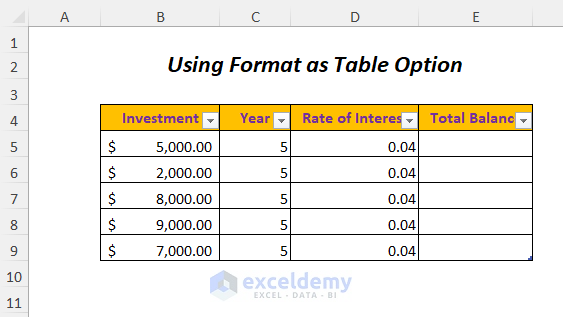
You will get the following table.
- Select the output cell E5.
- Use the following formula.
=[@Investment]+[@Investment]*[@Year]*[@[Rate of Interest]]Here, [@Investment] is the invested amount, [@Year] is the time period, and [Rate of Interest] is the interest rate.
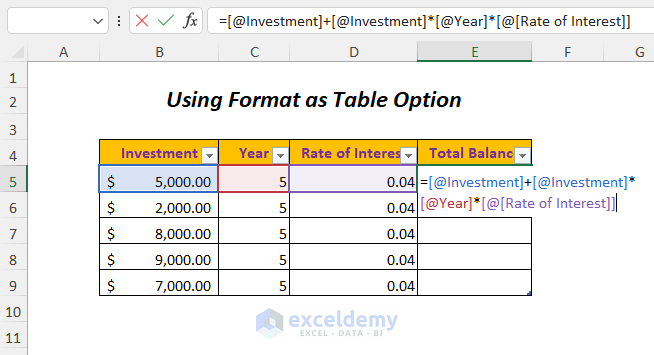
- Press Enter.
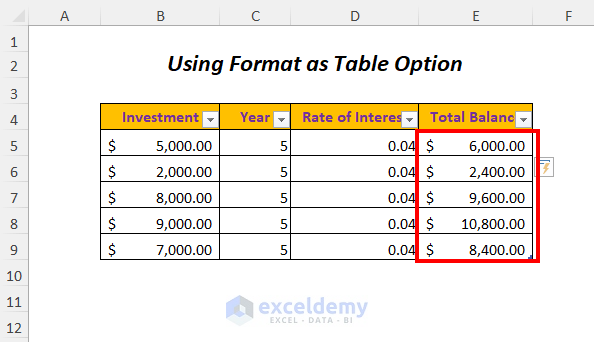
Result:
You will get the Total Balance for different Investments.
Method 6 – Using the Table Option to Create a Data Table in Excel
You can get the values of the Total Balance for different Investments by using the Table option.
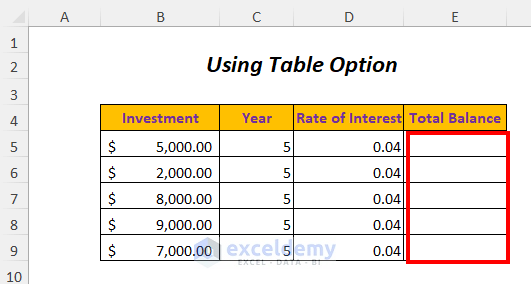
Steps:
- Go to the Insert tab and select the Table option.
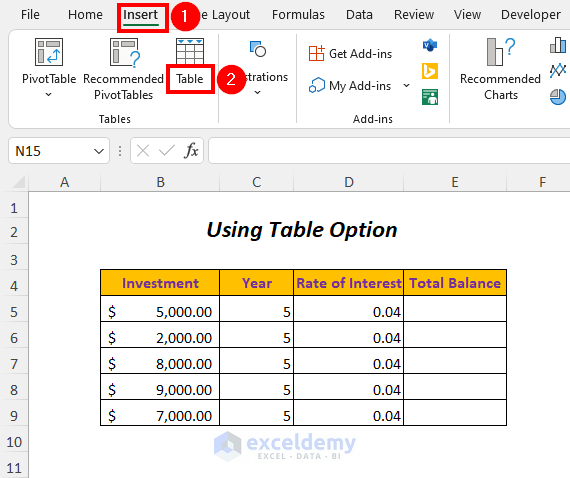
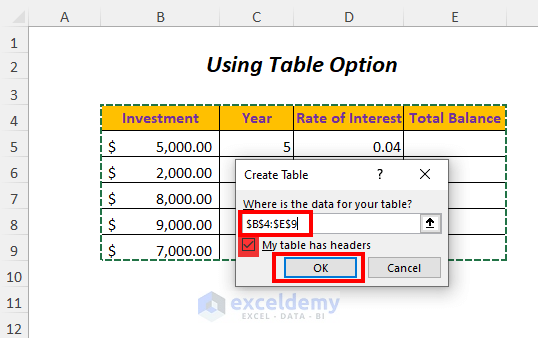
The Create Table dialog box will open up.
- Select the data range.
- Click the My table has headers option.
- Press OK.
You will get the following table.
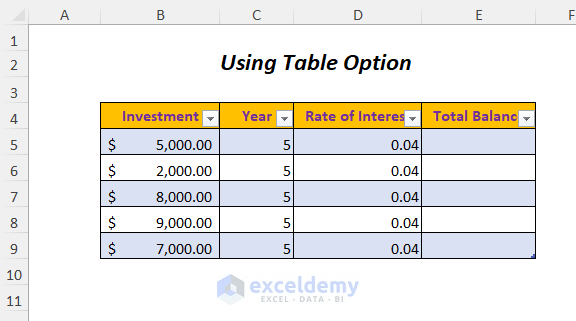
- Select the output cell E5.
- Insert the following formula.
=[@Investment]+[@Investment]*[@Year]*[@[Rate of Interest]]Here, [@Investment] is the invested amount, [@Year] is the time period, and [Rate of Interest] is the interest rate.
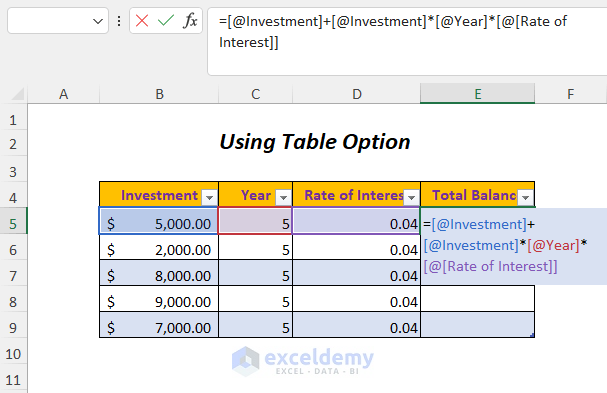
- Press Enter.
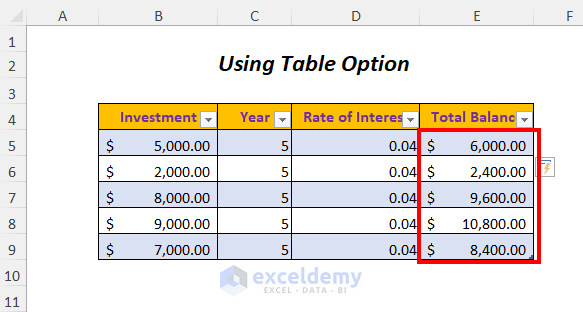
Result:
You will get the Total Balance for different Investments.
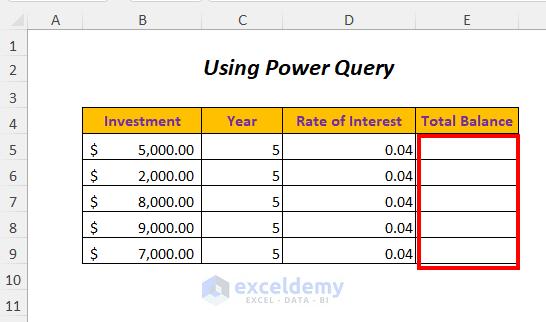
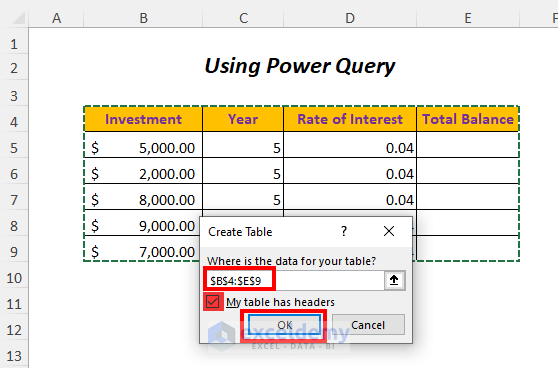
Method 7 – Using Power Query to Create a Data Table in Excel
We will get the values of the Total Balance for different Investments by using the Power Query Option.
Steps:
- Go Data and select the FromTable/Range option.
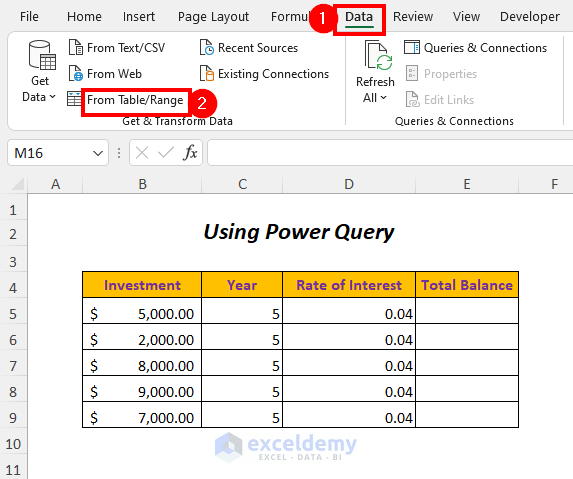
The Create Table dialog box will open up.
- Select the data range.
- Click the My table has headers option.
- Press OK.
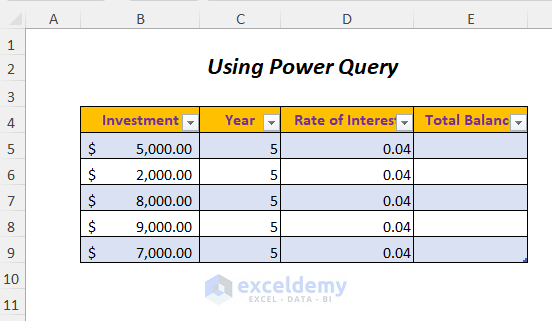
You will get the following table.
- Select the output cell E5.
- Use the following formula.
=[@Investment]+[@Investment]*[@Year]*[@[Rate of Interest]][@Investment] is the invested amount, [@Year] is the time period, and [Rate of Interest] is the interest rate.
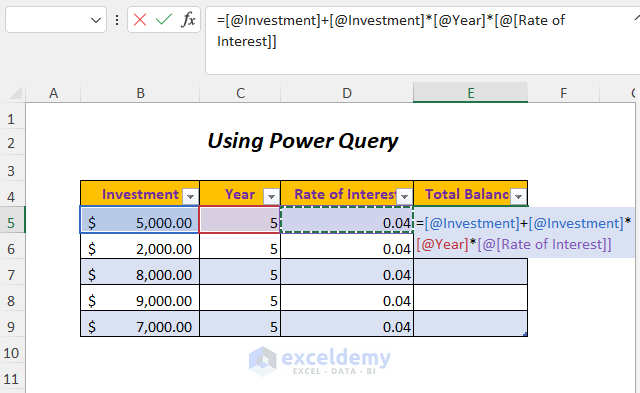
- Press Enter.
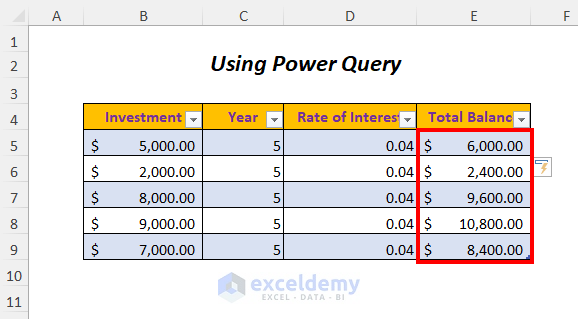
Result:
You’ll get the Total Balance for different Investments.
Read More: How to Create Data Table with 3 Variables
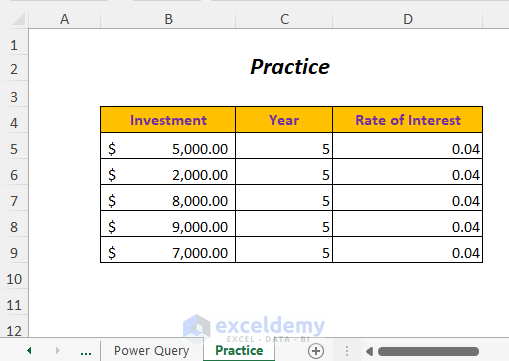
Practice Section
We have provided a practice section like below in a sheet named Practice.
Download the Practice Workbook
<< Go Back to Data Table in Excel | What-If Analysis in Excel | Learn Excel
Get FREE Advanced Excel Exercises with Solutions!
