What Is Scenario Manager?
The Scenario Manager can compare datasets with different values. You can change the set of values and perform an analysis ...
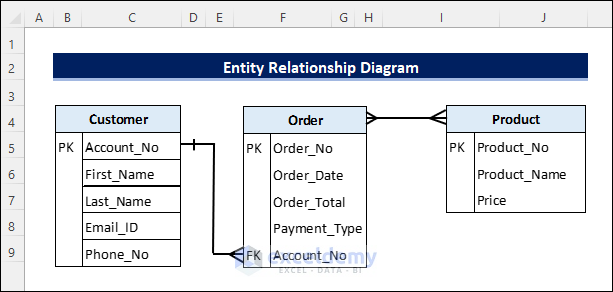
Sometimes, we may need a little amount of information from a large set of a data table. In this case, creating a relationship between the tables is ...