The Population Pyramid is a very useful tool for population statistics. It helps to analyze the population data of age and gender. In this article, we will show 3 easy methods to make a Population Pyramid in Excel.
What Is Population Pyramid?
The Population Pyramid is nothing but a graphical representation of population size by age and gender. With the help of the population pyramid, we can easily understand the relationship between age and gender in population data. If the size of the population grows, the graph takes the shape of a pyramid. That’s why it is known as the population pyramid.
Making a population pyramid is quite easy with the help of Excel. Here we will discuss 3 easy and simple methods to make it.
1. Applying an Excel Bar Chart to Create a Population Pyramid
We can create the Population Pyramid by using an Excel Bar Chart. The steps to do that are given below.
- First, we have to create a dataset that should include the population size by age and gender. We have to put the summation of the population in a cell. In our case the cell is C13.

- Now we need to calculate the percentage of the male population in cell E5. For that, we have to write the following formula in the cell.
=C5/$C$13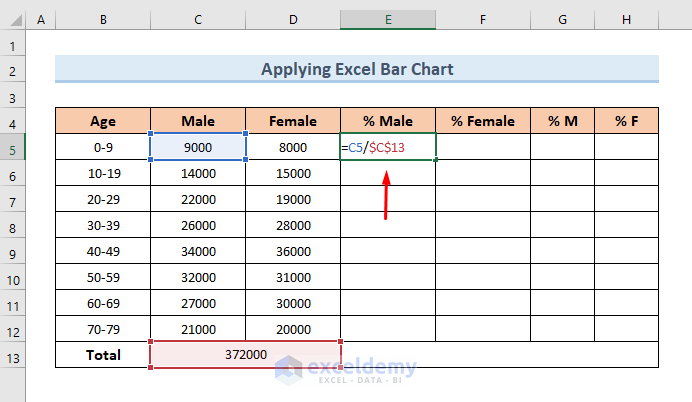
Here, C5 is the cell for the male population by age and $C$13 is the fixed cell for the total population.
- Then we have to press Enter and use Fill Handle to copy the formula to the cells below.

- Next, we have to calculate the percentage of the female population by age. We will write the following formula in the respective cell F5. The formula is similar to the previous one.
=D5/$C$13
- Afterwards, we will press Enter and use Fill Handle to copy the formula in the cells below.
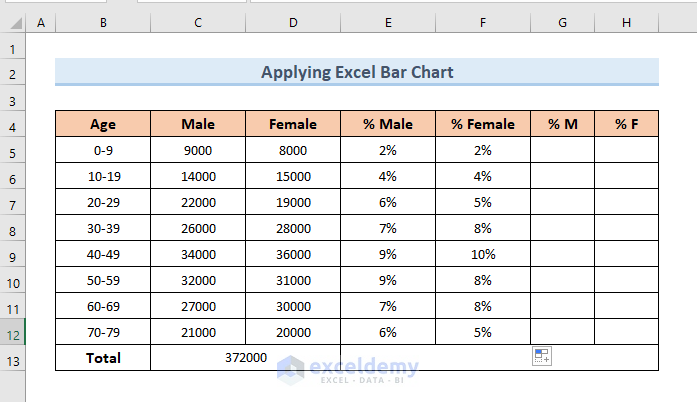
- We can see the percentage for each population range.
- Secondly, we will put the percentage values of males and females in separate 2 columns. And we have to put negative signs before the values of males (See Screenshot).

- Then we will select the new 2 columns having percentage values with a sign.

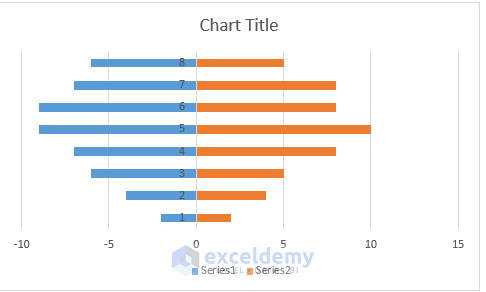
- After that, we need to go to Insert tab > Bar Chart and select Stacked Bar from 2D Bar.

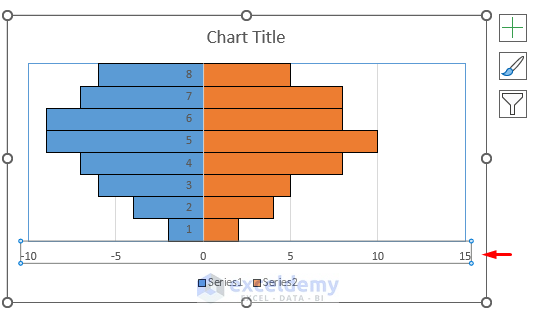
- We will see a chart like below.
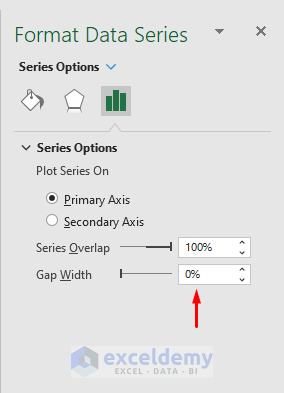
- Thirdly, we will do some formatting now. We have to select the diagram and right-click on it and select Format Data Series.
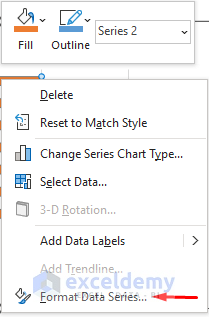
- From the series option, we will change the gap width to 0%.
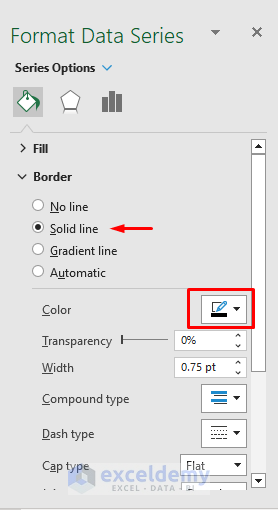
- We will select Fill & Line and will choose a Solid line as the Border.
- Now we will work on the X-axis. We have to select the X-axis and right-click on it.
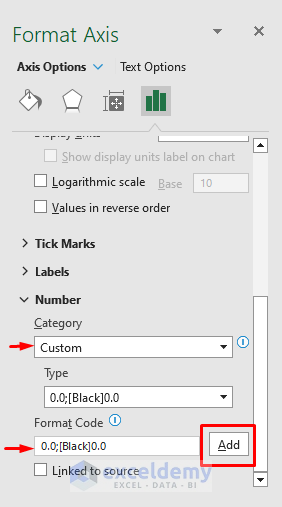
- From the Format Axis we have to choose Category as Custom and add Format Code as 0.0;[Black]0.0.
- Later on, we have to click on the Y-axis and right-click on it.
- From the Format Axis option, we will choose Label Position as Low.

- That’s it! Finally, our population pyramid is prepared.
2. Making a Population Pyramid with Conditional Formatting
We can also create a population pyramid with conditional formatting. We will discuss the method below stepwise.
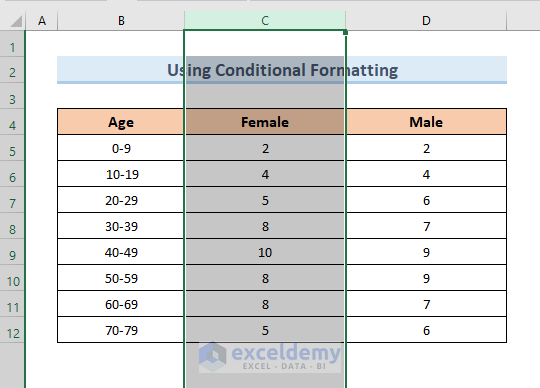
- First, we have to create a dataset having age range and male-female population percentage data.

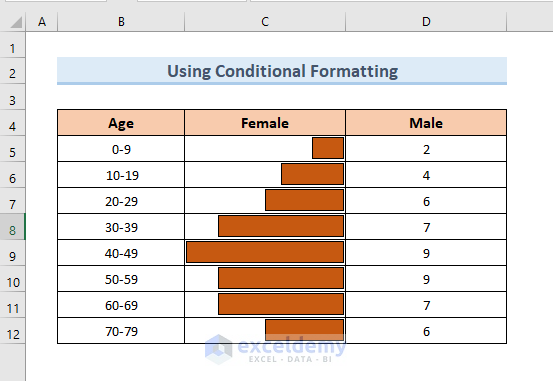
- Then we have to select the column having female percentage data. In our case the column is C.
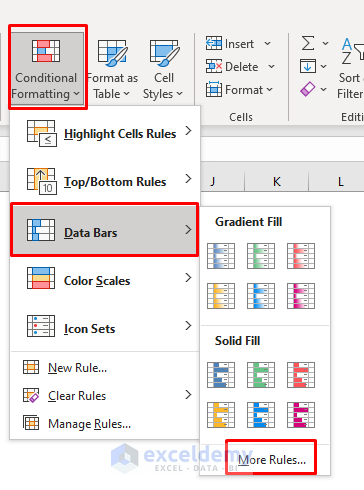
- Now we go to Conditional Formatting in the Home tab in the ribbon and select Data Bars > More Rules.
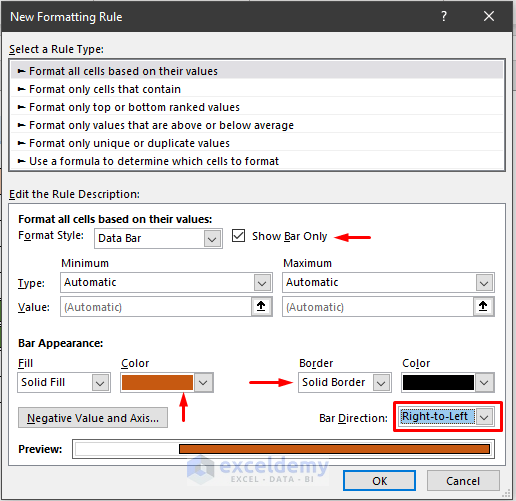
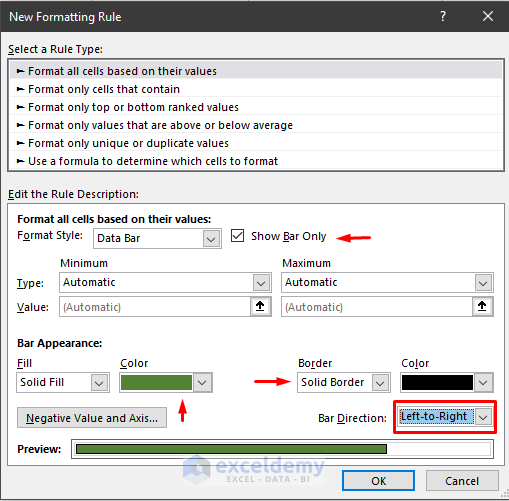
- In the New Formatting Rule box, we have to select Format all cells based on their values option.
- Next, in Edit the Rule Description part put a tick mark on the Show Bar Only box.
- In the Bar Appearance part, we need to choose the color of our diagram and choose the Fill as Solid Fill.
- Here, also select a black color border and set the Bar Direction as Right-to-Left.
- Further, we need to press OK and we will see the diagram for the female population.
- After that, we will select the column having male population percentage data.

- Go to Conditional Formatting in the Home tab in the ribbon > select Data Bars > More Rules.
- In the New Formatting Rule box, we have to select Format all cells based on their values option.
- To edit the rule description like the previous steps, check the option Show Bar Only.
- Here, we will choose the color of our diagram and select a black color border as in the previous steps. See the screenshot for a better understanding.
- Then select Bar Direction as Left-to-Right.
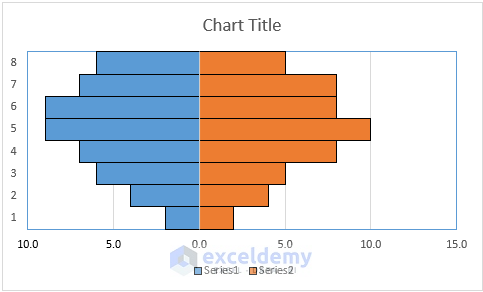
- In the end, we have to press OK and we will see the diagram below.
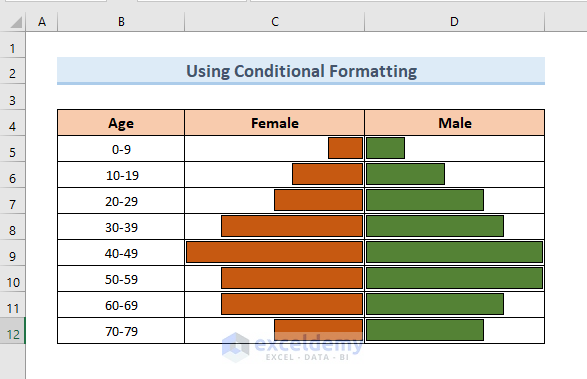
- Finally, we have created the Population Pyramid using conditional formatting.
3. Generating In Cell Population Pyramid in Excel
We can also create the population pyramid in cells. The steps are given below.
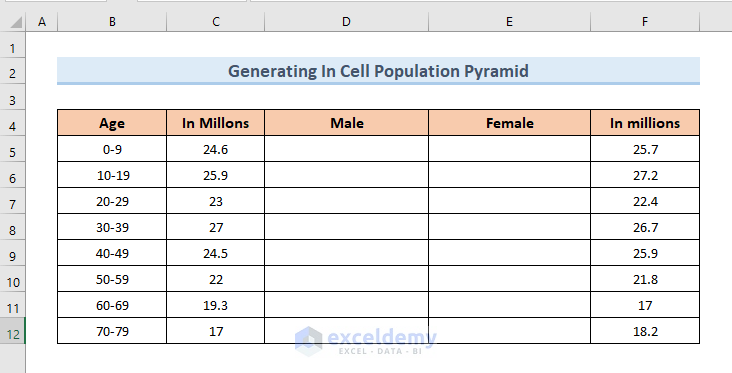
- First, we have to make a dataset having an age range and male-female population. We need to keep blank columns in the middle where we want to create the population pyramid (See Screenshot).
- In the 1st cell of the male (D5), we need to write the formula given below.
=IFERROR(REPT("|",C5*4),"")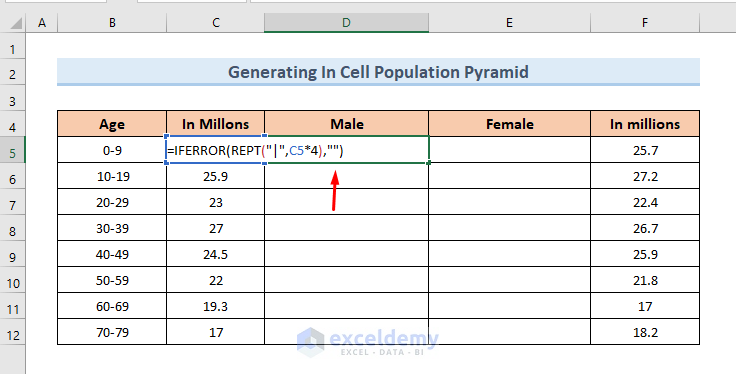
The formula will prepare the data for the population pyramid.
- Now we will press Enter and use the Fill Handle to copy the formula in the cells below.

Here, the REPT function puts (|) in the cell 4 times the value of the C5 cell. The IFERROR function checks the error and puts an empty string if an error occurs.
- We have to follow similar steps for the female population data. For that, in cell E5, write down the below formula:
=IFERROR(REPT("|",F5*4),"")
- After that, press Enter and use the Fill Handle to copy the formula in the cells below.
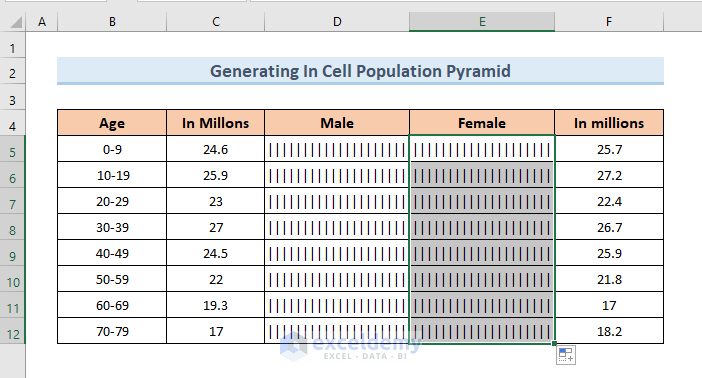
In this formula, the REPT function puts (|) in the cell 4 times the value of the F5 cell whereas the IFERROR function checks the error and puts an empty string if an error occurs.
- Then we need to select the whole data of the new 2 columns.
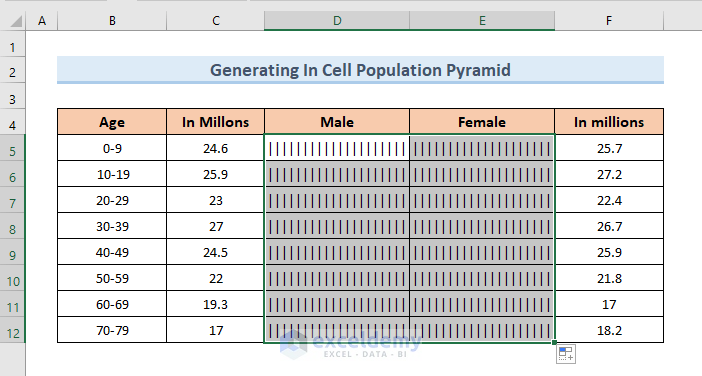
- Further, we will change the font to Playbill and choose a font color for the diagram from the Home tab.
- We need to align the female data column on the left and the male data column on the right.

- In the end, we can see the population pyramid.
Read More: How to Create Age Distribution Graph in Excel
Download Practice Workbook
You can download the practice workbook from here.
Conclusion
The Population Pyramid is a vital tool for analyzing population data with age and gender. In this article, we have shown 3 easy methods to make a Population Pyramid in Excel. If you face any problem following the steps or if you have any suggestions, please let us know by commenting
Related Articles
- How to Calculate Population Mean in Excel
- How to Calculate Population Growth Rate in Excel
- How to Analyze Demographic Data in Excel
- Population Projection Formula in Excel
- How to Create Age and Gender Chart in Excel
- How to Make Age Pyramid in Excel
<< Go Back to Excel Demographic Data | Excel for Statistics | Learn Excel
Get FREE Advanced Excel Exercises with Solutions!
