In this article, we will explore how to analyze demographic data in Excel using 5 different methods.
What Is Demographic Data?
Demographic data refers to statistical socioeconomic information that describes populations and their characteristics.. It may incorporate data on age, sex, gender, income, education, employment, fertility, mortality, etc. over a period of time in specific geographical locations. Demographic data is used to understand the distribution of these characteristics within a population, enabling analysis of trends, patterns, and relationships between variables.
How to Analyze Demographic Data in Excel: 5 Essential Methods
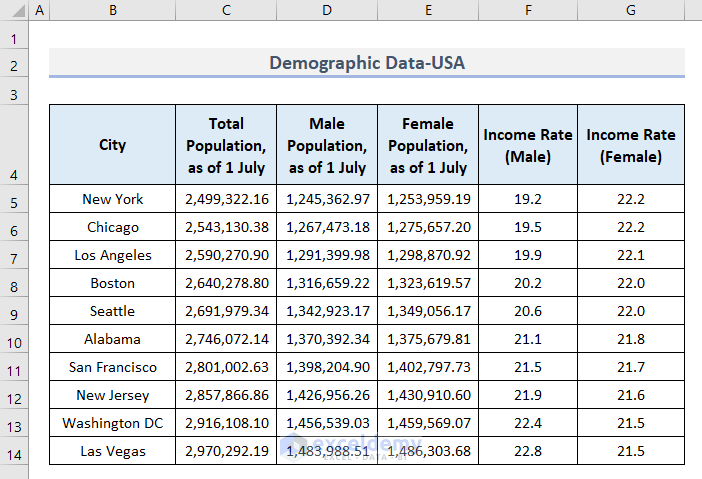
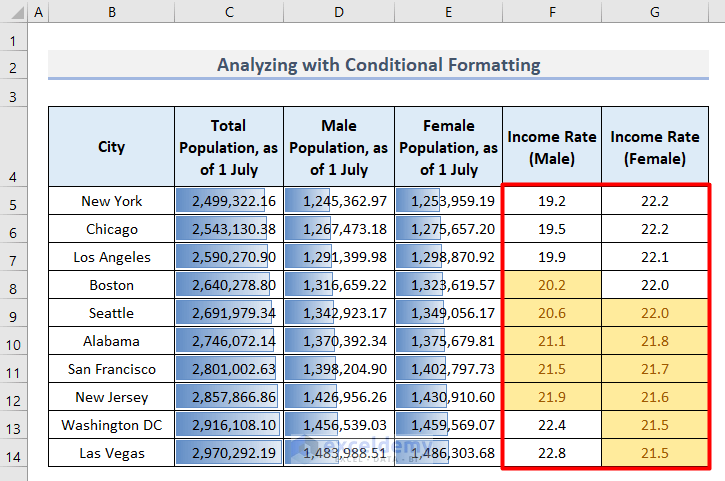
To illustrate our methods, we’ll use the sample dataset below, containing the Total Population, Male Population, and Female Population as of 1 July in 10 cities of the USA, along with the Male and Female Income Rates.
Here are 5 ways to analyze this demographic data in Excel.
Method 1 – Using the Sort & Filter Tool to Analyze Demographic Data
The Sort & Filter tool is very effective for the purpose of analyzing demographic data.
Steps:
- Select the whole dataset.
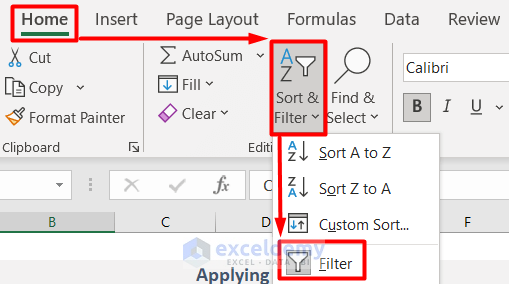
- Go to the Data tab and click on Filter from the Sort & Filter section.

This tool can also be accessed from Home > Editing > Sort & Filter > Filter.
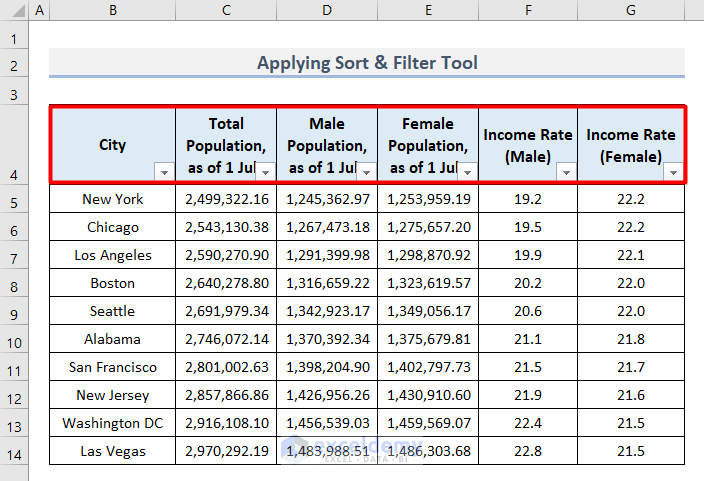
The Filter icons now appear beside the header titles.
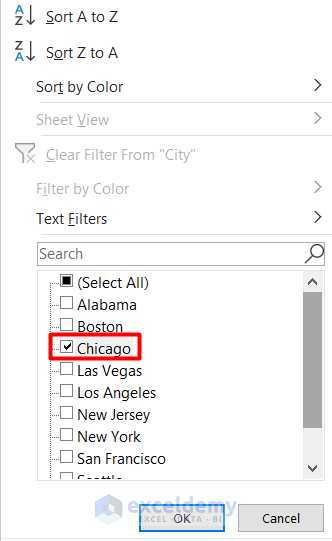
- Click on the filter icon beside the City title.
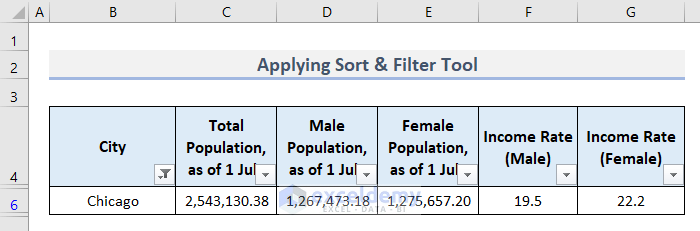
- Select Chicago as the Text Filter.
- Click OK.
We can now examine the demographic data only for Chicago.
Following the same procedure, we can zoom into any city’s demographic data.
Method 2 – Using a Pivot Table to Evaluate Demographic Data in Excel
The Pivot table is the most efficient way of evaluating demographic data in Excel.
Steps:
- Select the range B4:G14.
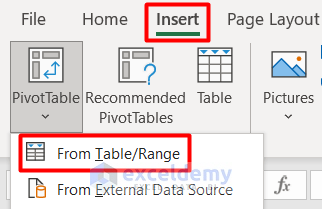
- Go to the Insert tab and click on PivotTable from the Tables group.
- Select the option From Table/Range.
The PivotTable from table or range dialog box will open.
- Provide the location where you want the new pivot table. Here, as we want the pivot table beside our original dataset, we selected Existing Worksheet and gave the Location as cell I4.
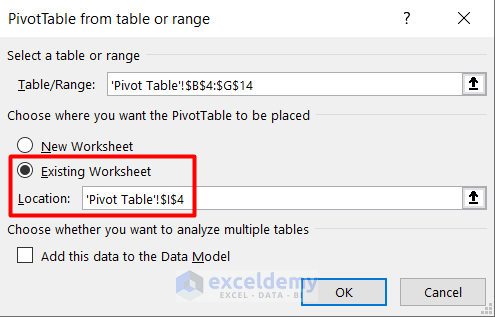
- Click OK.
The PivotTable Fields panel opens on the right side of the workbook.
- Drag City and Total Population into the Rows and Values boxes respectively.
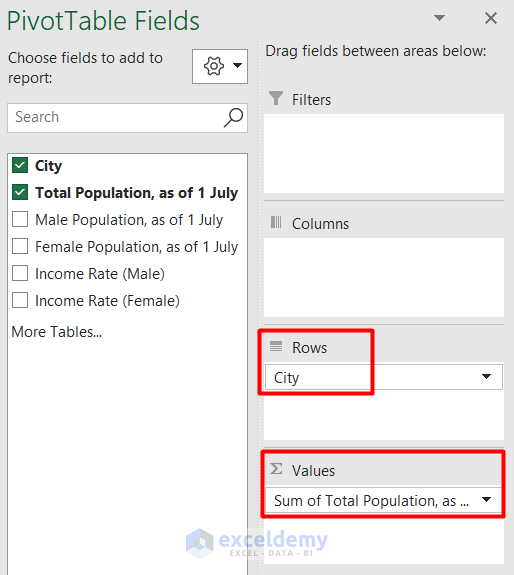
The summarized data of the cities and their total population are displayed.
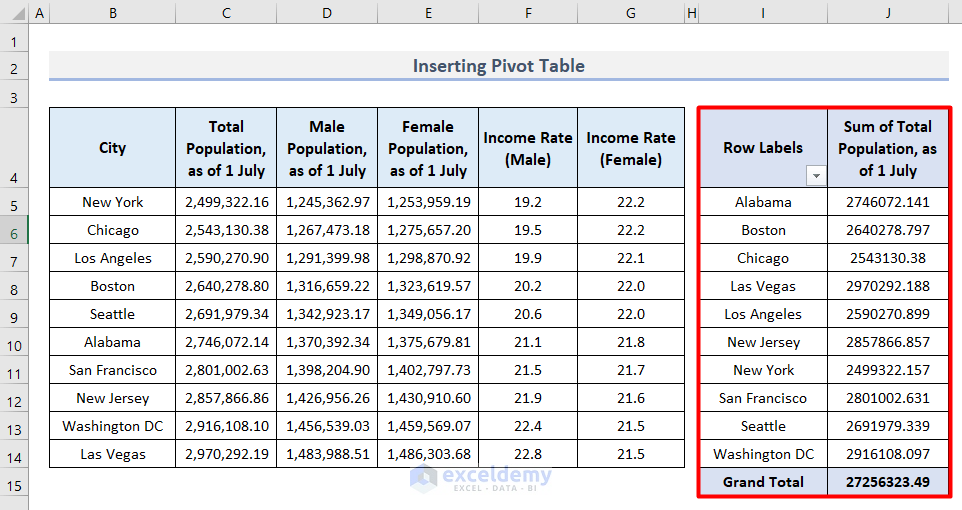
In this way, we can easily analyze specific segments of the demographic data as desired.
Method 3 – Using Conditional Formatting to Analyze Demographic Data
To analyze demographic data on the basis of certain conditions, Conditional Formatting is an efficient solution.
Steps:
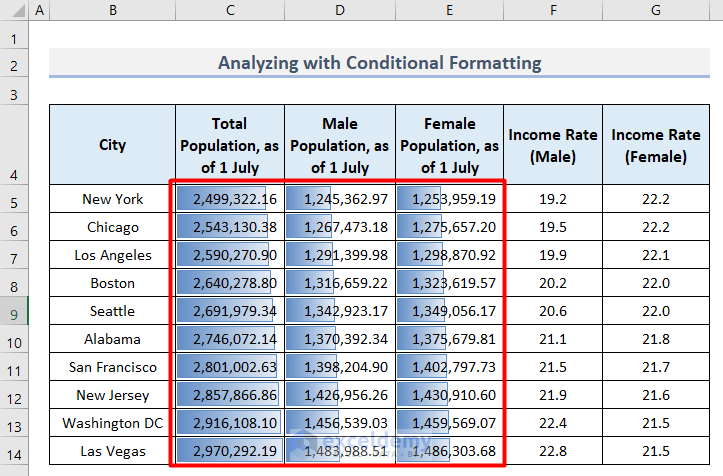
- Select the range C5:E14 (as we want a comparative analysis of the populations).
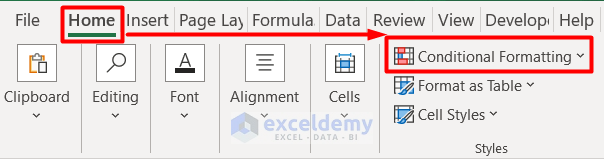
- Go to the Home tab and click on Conditional Formatting.
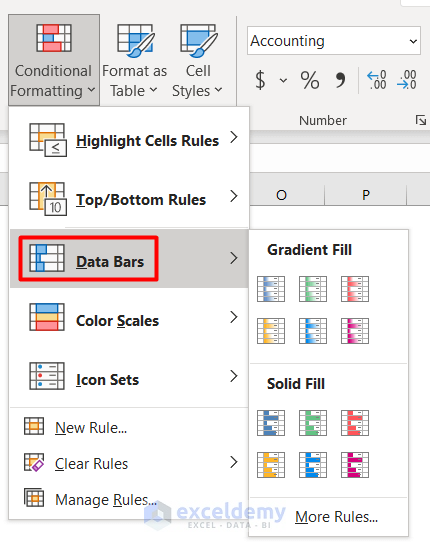
- Select Data Bars from the drop-down menu.
- Select the type of Gradient Fill or Solid Fill you prefer.
Data bars are added to the cells, providing a visual comparison between the values.
- To highlight certain values in the Income Rate columns, select Conditional Formatting > Highlight Cells Rules > Between.
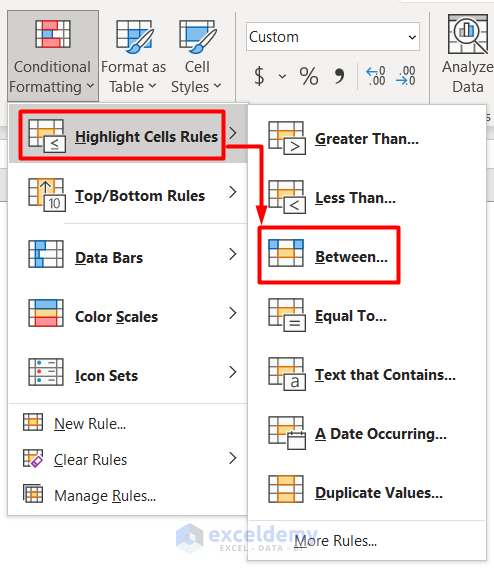
- In the Between dialog box that opens, insert the two values between which you want highlighted cells.
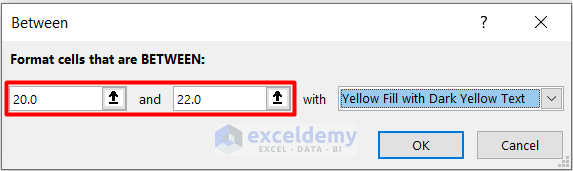
- Click OK.
The values between 20 and 22 are highlighted.
- Explore other options of Conditional Formatting to further analyze and highlight demographic data.
Method 4 – Using an Excel Chart to Inspect Demographic Data
We can create an Excel Chart to analyze the demographic data in our dataset.
Steps:
- Select the range B4:C14 (or any other cell range you prefer).
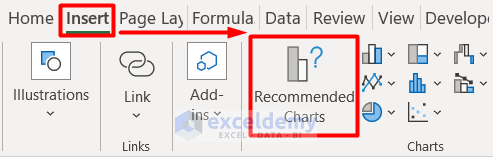
- Go to the Insert tab and click on Recommended Charts from the Charts group.
- Select Pie from the All Charts tab in the Insert Charts window.
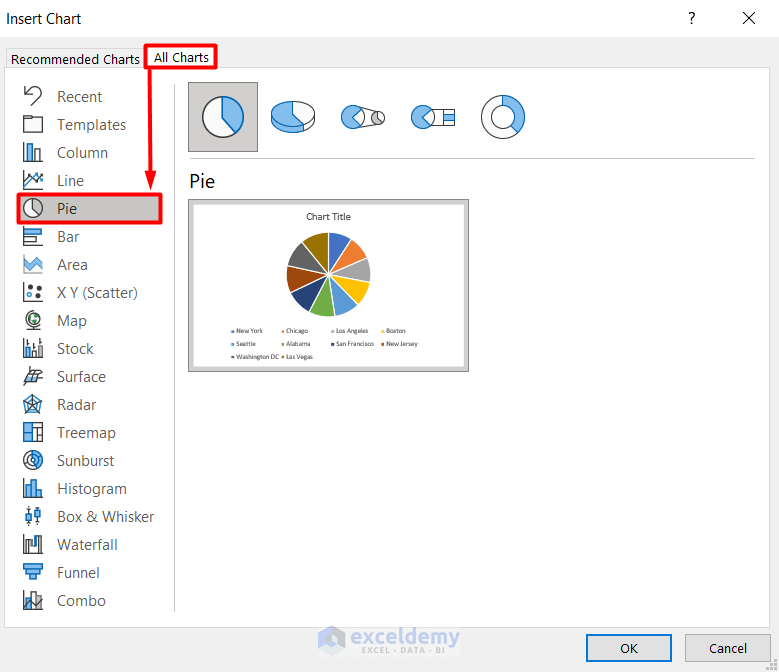
- Click OK.
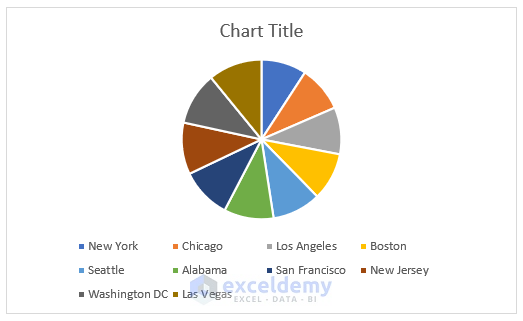
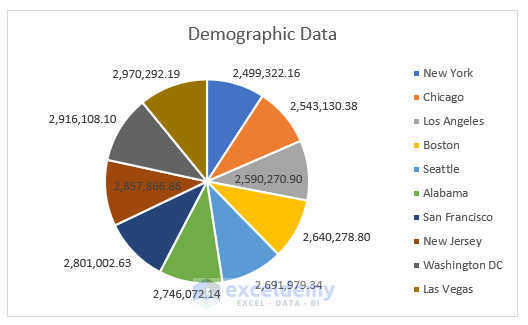
Our initial Pie Chart is generated.
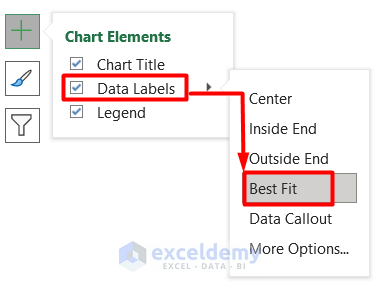
- Set the location of the Data Labels in the Chart Elements.
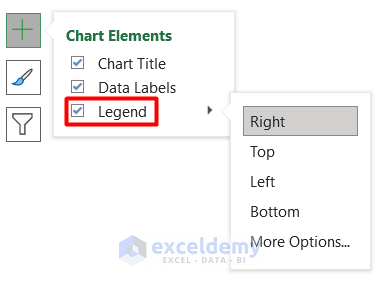
- Set the location of the Legend in the chart.
We have the Demographic Data in a Pie Chart for easy analysis.
To get more specific information:
- Click on the Filter icon beside the chart.
- Select the cities whose values you want in the chart.
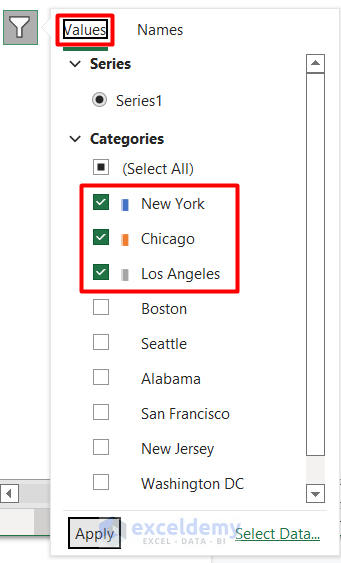
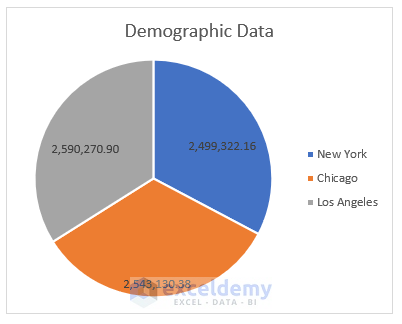
The output will look something like this:
Read More: How to Create Age Distribution Graph in Excel
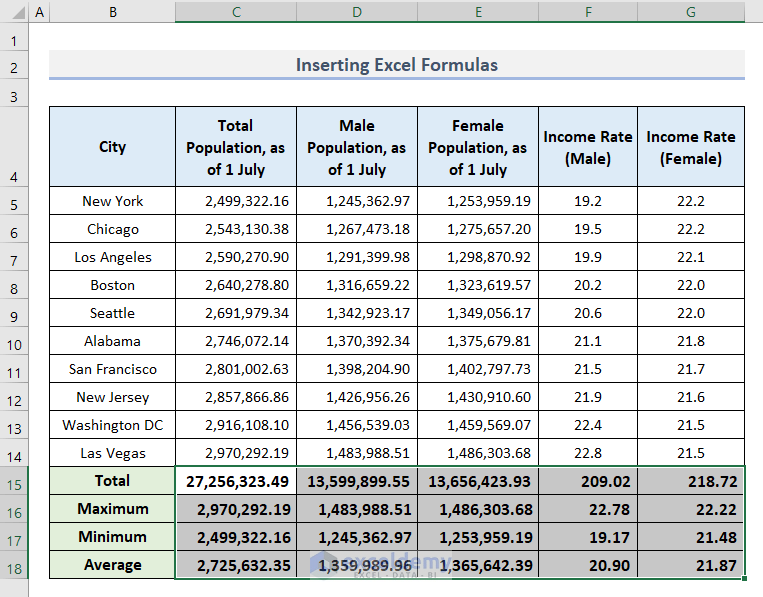
Method 5 – Using Excel Formulas for Demographic Data Analysis
In this last method, we will apply Excel formulas that make use of the SUM, MAX, MIN, and AVERAGE functions to analyze demographic data.
Steps:
- Insert the following formula in cell C15:
=SUM(C5:C14)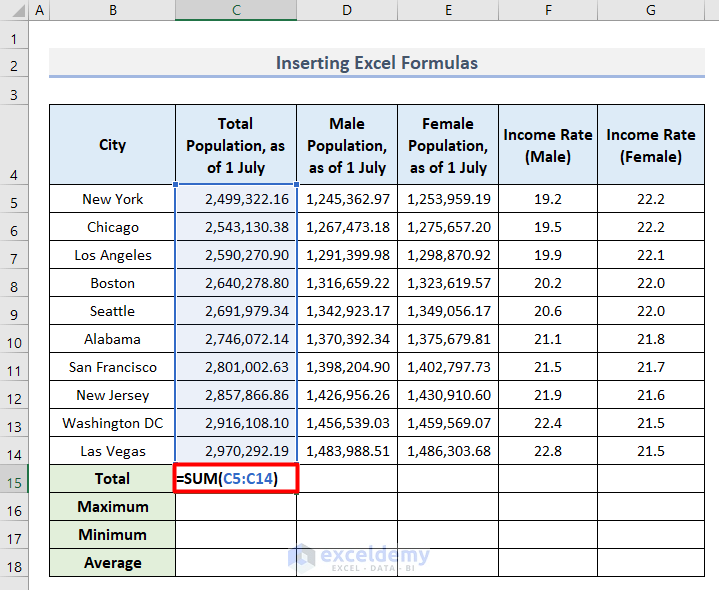
- Enter the following formula in cell C16 and press Enter:
=MAX(C5:C14)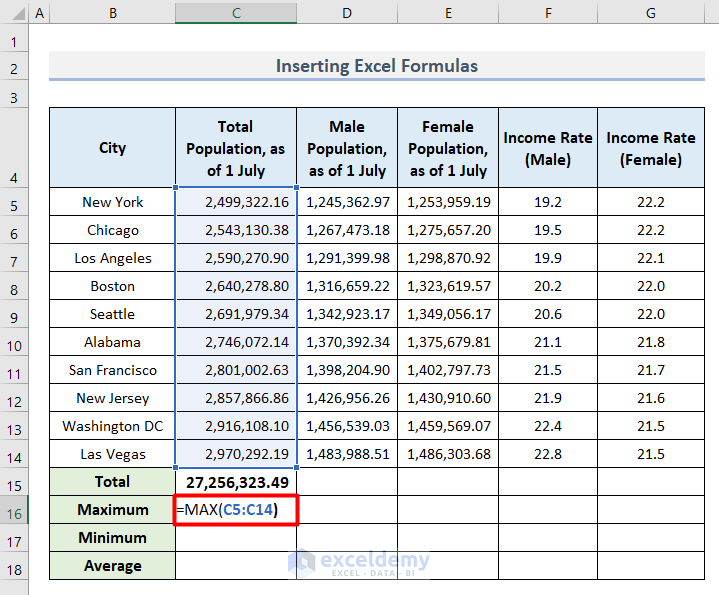
- Enter the following formula in cell C17:
=MIN(C5:C14)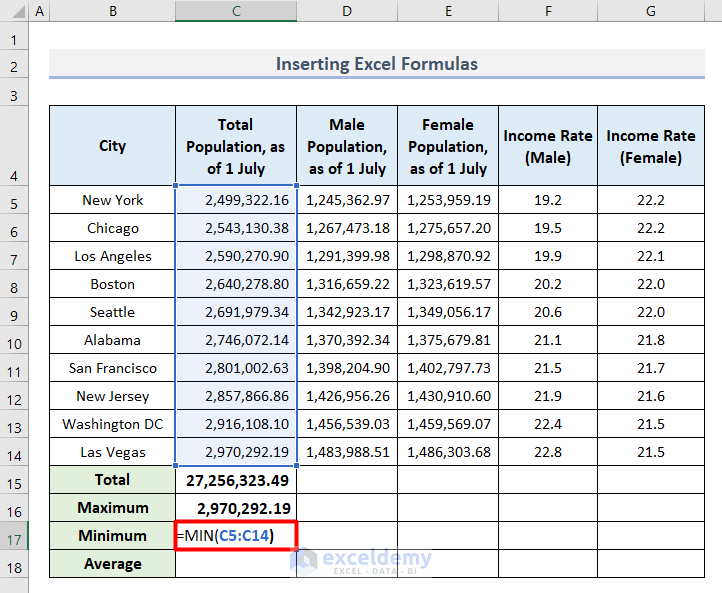
- Enter the following formula in cell C18 and press Enter:
=AVERAGE(C5:C14)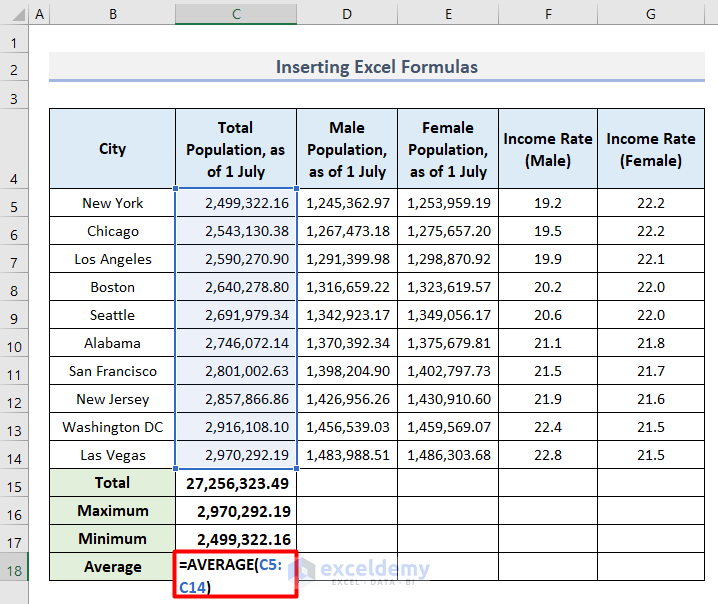
The output after using these formulas looks like this:
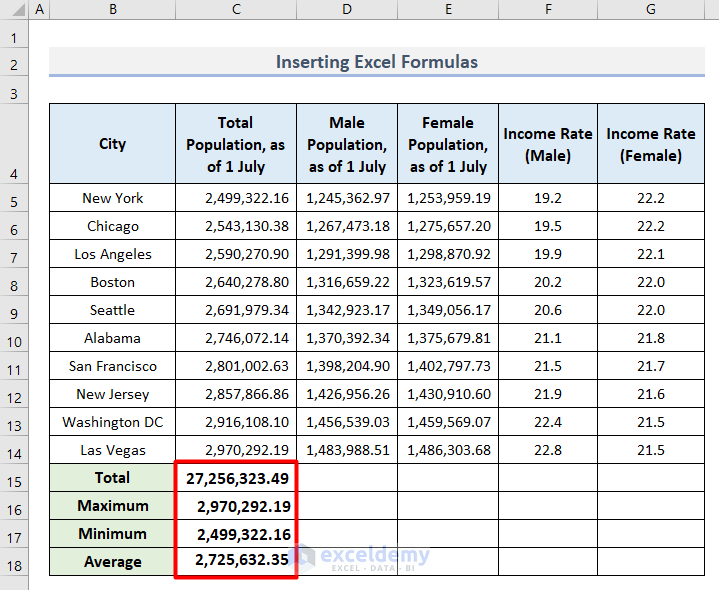
- Select the range C15:C18 and apply the AutoFill tool horizontally to cell G18.
We have the same statistics for all the columns of demographic data.
Read More: How to Create Age and Gender Chart in Excel
Things to Remember
- Avoid empty rows in your Demographic Data, because they will cause inaccurate analysis.
- Keep all the data in each column in the same format to obtain accurate output.
Download Practice Workbook
Related Articles
- How to Make a Population Pyramid in Excel
- How to Calculate Population Growth Rate in Excel
- Population Projection Formula in Excel
- How to Make Age Pyramid in Excel
<< Go Back to Excel Demographic Data | Excel for Statistics | Learn Excel
Get FREE Advanced Excel Exercises with Solutions!
