Excel Demographic Data

How to Create an Age and Gender Chart in Excel – 3 Examples

This is the sample dataset. The Y-axis value is placed on the left. Example 1 - Using a Stacked Bar Chart Without Gaps in Between Steps: ...

How to Create an Age Distribution Graph in Excel (2 Methods)

Method 1 - Creating a Graph Without Gaps Between Bars In this scenario, we want to display the Y-axis values to the left of the graph. To achieve ...

How to Make Age Pyramid in Excel (2 Suitable Methods)

The age pyramid, an especially useful tool for population statistics, helps to analyze the population with respect to age. In Microsoft Excel, we can ...

How to Calculate Population Growth Rate in Excel: 2 Effective Methods

Method 1 - Calculate Average Annual Population Growth Rate 
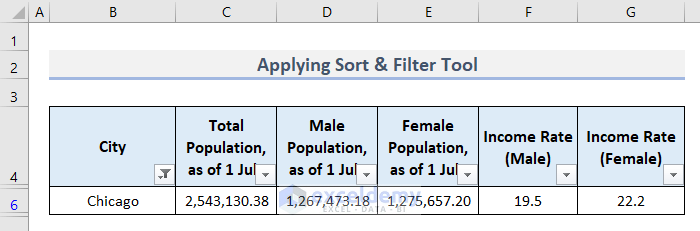
Find out the average annual growth rate of the population. Find the growth rate for each ...

How to Calculate Population Mean in Excel (2 Examples)

Sometimes, you need to calculate the average of a big group. Calculating the average manually is a time-consuming process. That’s why we can take the ...

How to Make a Population Pyramid in Excel (3 Easy Methods)

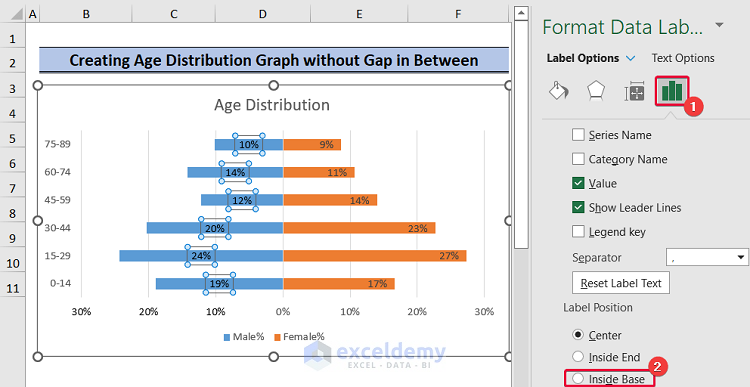
The Population Pyramid is a very useful tool for population statistics. It helps to analyze the population data of age and gender. In this article, ...

Population Projection Formula in Excel (3 Applications)

There are 3 common ways you can forecast or project the future population in Excel. Linear Projection Geometric Projection Exponential ...

How to Analyze Demographic Data in Excel (5 Essential Methods)

In this article, we will explore how to analyze demographic data in Excel using 5 different methods. What Is Demographic Data? Demographic ...

Close the CTA

Advanced Excel Exercises with Solutions PDF


ExcelDemy
Logo