There are 3 common ways you can forecast or project the future population in Excel.
- Linear Projection
- Geometric Projection
- Exponential Projection
Linear projection is rarely used. It should be used only when the population censuses from the recent past are available, the population growth rates are stable, and the projection year is in the near future. This method assumes that the population is increasing at a constant rate.
Geographical projection is the most used projection method. It focuses on the percentage change rather than the numeric change of the population. Instead of consistency in numeric increase, it assumes the growth rate is constant.
In exponential projection, the rate of change in population is assumed to be directly proportional to the current population and the growth rate percentage.
Method 1 – Linear Population Projection Formula
The Linear Population Projection formula is:
Where,
Pt = Projected Population
P0 = Latest Population
m = Average Increase
∆t = Number of Periods
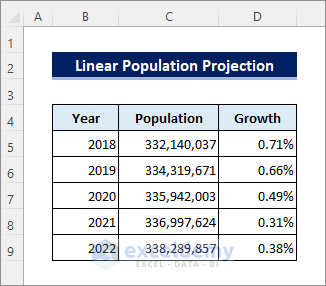
The following dataset contains the population of the last 5 years in the USA. We have calculated the population growth in column D.
Steps:
- Add the following formula in cell E6 and drag the Fill Handle icon below.
=C6-C5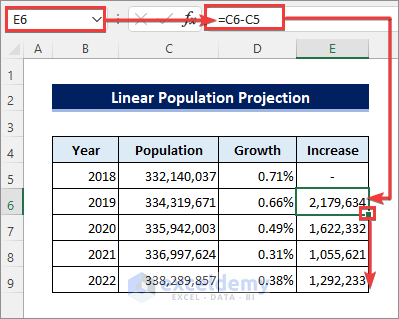
- Apply the following formula in cell E11 to get the average increase using the AVERAGE function.
=AVERAGE(E5:E9)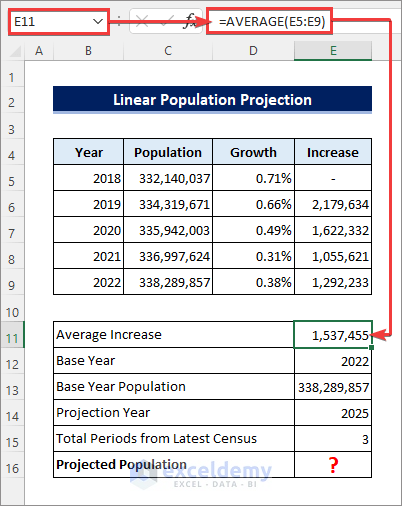
- Enter the following formula in cell E16 to get the projected population.
=E13+E15*E11 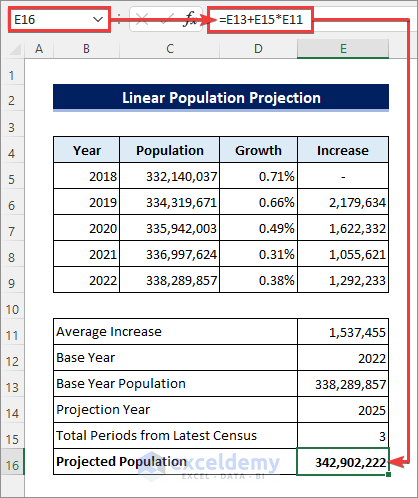
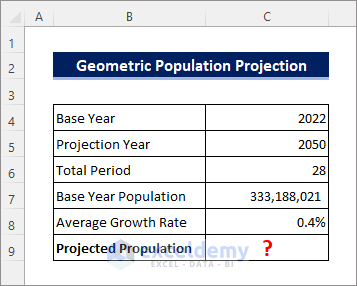
Method 2 – Geometric Population Projection Formula
The Geometric Population Projection formula is:
Where,
Pt = Projected Population
P0 = Base Year Population
r = Growth Rate
n = Number of Periods
- This sample dataset contains the base year population, the average growth rate for the coming years, and the total number of periods until the projection year.
- Apply the following formula in cell C9 to get the Geometric Population Projection.
=C7*(1+C8)^C6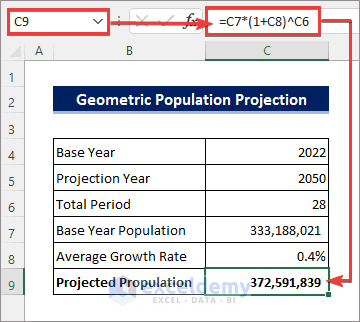
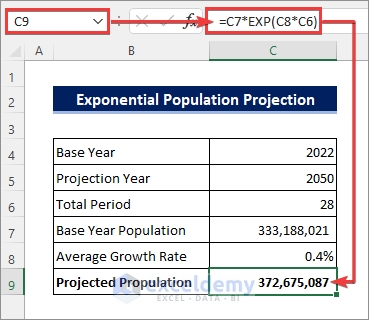
Method 3 – Exponential Population Projection Formula
The Exponential Population Projection formula is:
Where,
Pt = Projected Population
P0 = Base Year Population
r = Growth Rate
t = Total Periods
- Enter the following formula in cell C9 to get the Exponential Population Projection.
=C7*EXP(C8*C6)- We used the EXP function, which returns the value of the constant e based on the power.
Read More: How to Analyze Demographic Data in Excel
Things to Remember
- Try to avoid using the linear projection unless you have enough data that meets the criteria described earlier.
- You may find a slight difference in the results using the geographical and exponential projections.
Download Practice Workbook
Related Articles
- How to Create Age and Gender Chart in Excel
- How to Make Age Pyramid in Excel
- How to Create Age Distribution Graph in Excel
- How to Make a Population Pyramid in Excel
- How to Make a Population Pyramid in Excel
<< Go Back to Excel Demographic Data | Excel for Statistics | Learn Excel
Get FREE Advanced Excel Exercises with Solutions!
