Sometimes, you need to calculate the average of a big group. Calculating the average manually is a time-consuming process. That’s why we can take the population mean to calculate the average of that certain group. The population mean is basically a way of calculating the mean where we extract certain group members. The group members can be selected in a certain way where all the possible categories must be present. This article will show how to calculate the population mean in Excel.
Overview of Population Mean
The population mean can be defined as the average of a given group. This is basically the arithmetic mean of that certain group. The best possible way to calculate the population mean is to estimate the sum of each data and then, divide it by the total number of data points. For example, you want to calculate the average age of New York City. First, you need to add all the ages and divide it by the total number of people. It is a very time-consuming and irritating process to count all of the ages individually. We may take a sample collection where every single category will be present. After that, we calculate the population mean as a whole.

Uses of Population Mean
The population mean is basically used for getting an average from a certain group. For example, we have college data where 1100 students are studying together. If you want to calculate the average CGPA of the organization, you will have to take help from the population mean. First, you need to sum up the CGPA of 1100 students. Then, divide it by the total number of students in that college. By doing this, you can easily get the mean of the large group, items, or any other things. The population mean produces the accurate value in terms of calculating the average. That’s why people prefer it rather than the sample mean. As a result, we will see the wide range of the population mean in every sector.
Population Mean vs Sample Mean
First of all, both sample mean and population mean are popular when it comes and statistics and probability. The sample mean can be defined as the mean of the sample derived from the population randomly, while the population mean is nothing but the mean of the entire group.
Calculating Time
The population mean takes more time because in this case, you have to consider all the values of that certain group. So, when you need to add the values individually, you have to consider more amount of time.
Whereas, the sample mean utilizes less time compared to the population mean because in this case, you have to take a sample from the population and then do the rest calculation.
Accuracy
In terms of accuracy, the population has the upper hand because it takes all the possible values from the group at a time. So, it produces the perfect arithmetic mean of that group.
While the sample mean is really easy to do, it lacks accuracy. When you take a random sample from the whole population, you have to consider some drawbacks like this because there is no way you can get accuracy compared to the population mean.
Difference in Symbols
There is a valid difference in symbols between the population mean and sample mean. Though these two averages are quite similar, they convey two different symbols.
- Symbol of Population Mean
The population mean symbol can be described as µ. When we focus on the equation of the population mean, we will see the following equation.

- Symbol of Sample Mean
The sample mean symbol can be described in the following screenshot.

Overall, the population mean can be the effective one but because it is tough and time-consuming, people often prefer the sample mean in place of the population mean.
How to Calculate Population Mean in Excel: 2 Suitable Examples
To calculate the population mean, we have found two suitable examples through which you can get a clear idea. In these two examples, we would like to show how to calculate the population mean for several height groups and also how to calculate the population mean for several age groups. As we all know, it is really tough to add all people’s heights and ages. After that, divide it by the total number of people. That’s why we take a sample where every possible category will be present and then use the population mean formula to calculate it.
1. Calculate Population Mean for Several Height Groups
In our first method, we would like to calculate the population mean for several height groups. We assume a population where we have several heights. But it is really tough to take all the people’s heights and add them all together. Then, divide it by using the total number of people. In order to reduce the difficulty, we can take a sample where we try to cover all possible heights. Finally, do the calculation of the population mean. To show the examples, we take a dataset that includes some height in centimeters.

Steps
- First, we need to calculate the total number of data points.
- In order to do this, we would like to utilize the COUNTA function.
- Select cell E4.
- Then, write down the following formula.
=COUNTA(B5:B14)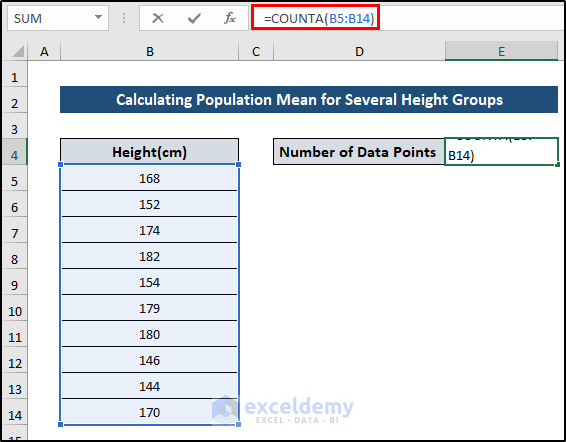
- After that, press Enter to apply the formula.

- Next, we would like to calculate the population mean.
- Select cell E5.
- Then, write down the following formula using the SUM function.
=SUM(B5:B14)/E4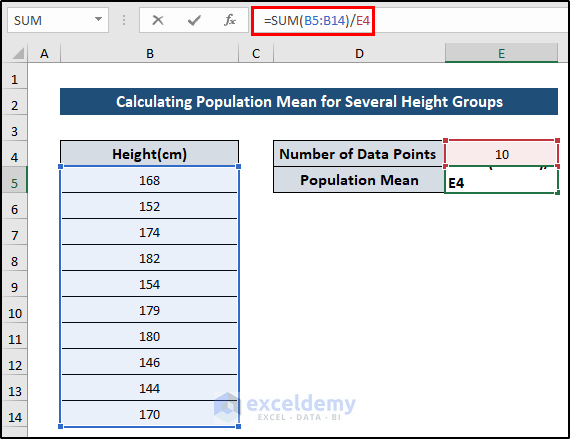
- After that, press Enter to apply the formula.

2. Calculate Population Mean for Several Age Groups
In our second method, we would like to calculate the population mean for several age groups in Excel. We assume a population where we have several ages. But it is really tough to take all the people’s ages and add it all together. Then, divide it by using the total number of people. In order to reduce the difficulty, we can take a sample where we try to cover all possible ages. Finally, do the calculation of the population mean. To show the examples, we take a dataset that includes some ages in years.

Steps
- First, we need to calculate the total number of data points.
- In order to do this, we would like to utilize the COUNTA function
- Select cell E4.
- Then, write down the following formula.
=COUNTA(B5:B14)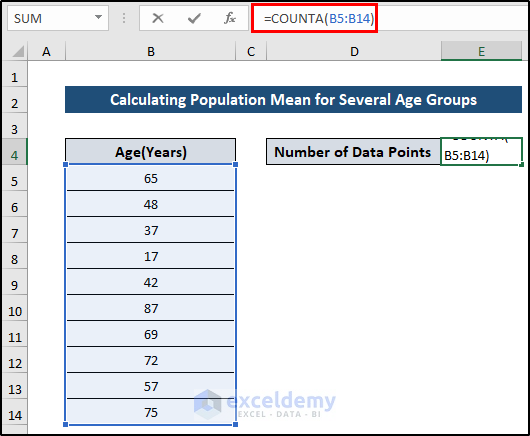
- After that, press Enter to apply the formula.

- Next, we would like to calculate the population mean.
- Select cell E5.
- Then, write down the following formula using the SUM function.
=SUM(B5:B14)/E4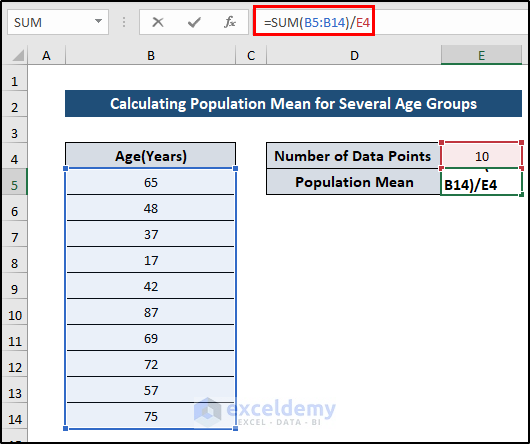
- After that, press Enter to apply the formula.

Things to Remember
- You can calculate the population mean by the AVERAGE function. It will provide the same result.
- People try to utilize the sample mean when the dataset is too big and becomes impossible to calculate it manually. Because even if the sample mean provides less accurate results, it helps to save some valuable time to do other things.
Download Practice Workbook
Download the practice workbook below.
Conclusion
We have shown two suitable examples to calculate the population mean in Excel. At the same time, we have also included the difference between the population mean and the sample mean. When you go through this article properly, I hope it will provide you with a complete overview of this topic. If you have any questions, feel free to ask in the comment box.
Related Articles
- How to Make a Population Pyramid in Excel
- Population Projection Formula in Excel
- How to Create Age and Gender Chart in Excel
- How to Make Age Pyramid in Excel
- How to Create Age Distribution Graph in Excel
- How to Calculate Population Growth Rate in Excel
- How to Analyze Demographic Data in Excel
<< Go Back to Excel Demographic Data | Excel for Statistics | Learn Excel
Get FREE Advanced Excel Exercises with Solutions!
