Latest Posts From Mehedi Hasan Shimul

In this article, we will demonstrate how to remove links in Excel. You will learn how to – Remove links from hyperlinks – Extract text value from link ...

This article will demonstrate various methods to check, count, remove, and filter duplicates in Excel. You will learn how to - Highlight duplicates - ...
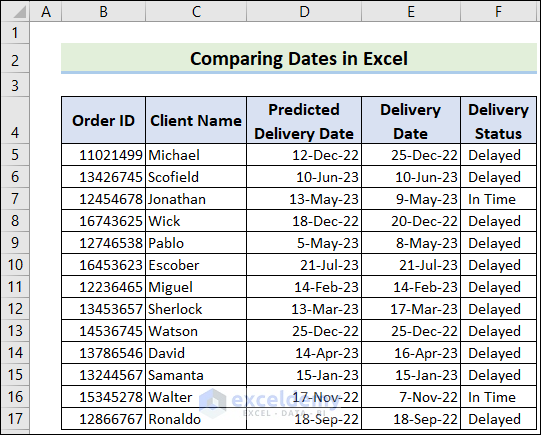
Dataset Overview We'll use the following dataset to demonstrate these methods. We have two columns: Predicted Delivery Date and Delivery Date. Our goal is to ...
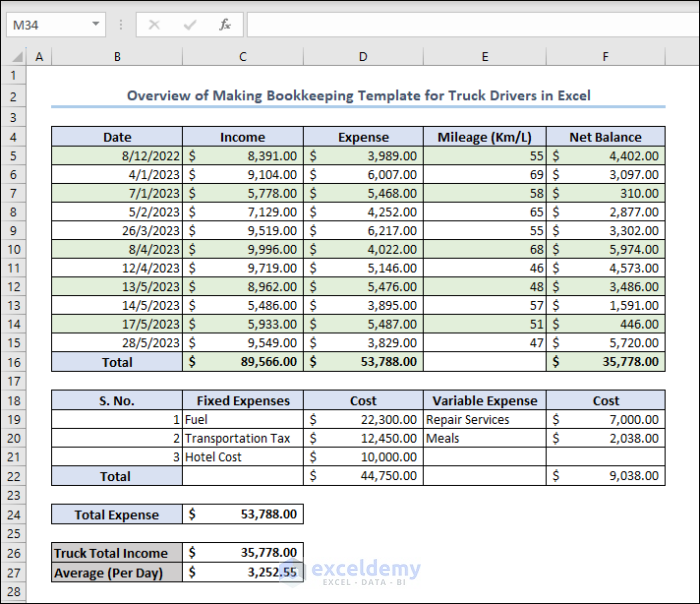
Here's an overview of the template we'll make in the article. Bookkeeping for Truck Drivers in Excel: Step-by-Step Procedure Step 1 - ...

In this article, we will explore the idea to evaluate a string as a formula in Microsoft Excel. The necessity of this feature is discussed, especially in ...

Here's an overview of a matrix in Excel and the functions that create inverse matrices. Download the Practice Workbook Inverse Matrix.xlsm ...

Method 1 - Calculating Sum with Numeric Not Equal Single Criteria Use the following formula in a cell of your worksheet. =SUMIF(E5:E17, ...

We'll use the following simple dataset of employees to demonstrate how to create more dynamic tables. Method 1 - Using the Excel Table and Named Range ...

Type 1 - Making a Bill of Materials for a Single Product Step 1. Create a Basic Dataset for Making a Bill of Materials We have taken a ...

Download the Practice Workbook Convert Scientific Notation to Number.xlsx Method 1 - Apply the INT Function to Convert Scientific Notation to a ...
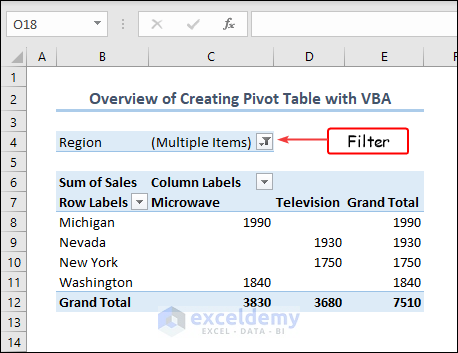
Method 1 - Inserting a Pivot Table with CreatePivotTable Command Steps: Create a dataset to insert the pivot table. Check out our dataset for ...

Visual Basic for Applications (VBA) is a programming language commonly used in Microsoft Excel, Word, and other Office applications. Calling a Sub or Private ...

Method 1 - Using VBA Do While Loop to Print Values Till Cell Is Not Empty We prepared a dataset with Employee ID, Name, Designation We have included data ...

Here's an overview of how VBA handles errors while performing loops. How to Launch the VBA Editor in Excel Click on the Developer tab and ...

In this article, we will show 5 simple ways to use Excel VBA to list the files in a folder with a specific extension. In addition, we will show the method for ...
- 1
- 2
- 3
- …
- 6
- Next Page »
See Our Reviews at


Thank you for your queries. Let’s change the code a bit. Use the following code to copy the data and paste it as values.
Afterward, you will see result like this.
Thank you so much for your observation. We will rectify and update this error soon. Thanks again for your concern.
Hi MIGUEL,
We are glad, you asked the questions. It’s quite easy to import data from separate sheets and save it as separate documents. Simply, use the following code in a new module of VBA. Only, you have to change the file directory to save the doc file.
After running the code, you will see the doc files created according to your dataset.
Hi Anna!
You wanted to say what will happen if we input the same word with Upper and Lower case. The fact is Excel counts Upper and Lower case characters as the same. So you won’t have any issues. Even then I am showing one way to make your data to proper format first. Then, use the formatted text in the required formula.
=PROPER(B5)