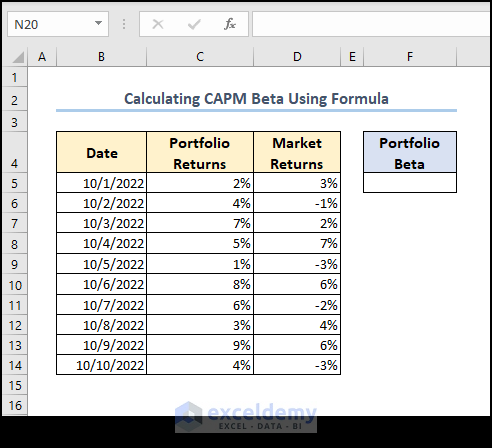
Method 1 – Calculating CAPM Beta Using Excel Formula
- Prepare a dataset containing Portfolio Returns (standard returns) and Market Returns data.
- Apply the following formula to Portfolio Beta (CAPM Beta).
=COVARIANCE.P(C5:C14,D5:D14)/VAR.P(C5:C14)
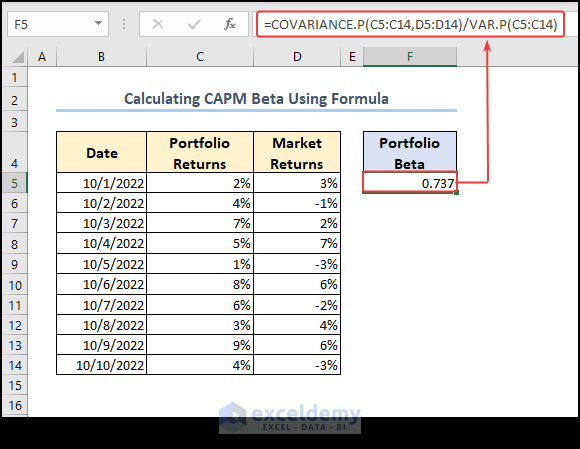
We determined the variance of data from range C5:C14 with the VAR.P function and divided the covariance output by the variance output to obtain the CAPM beta.
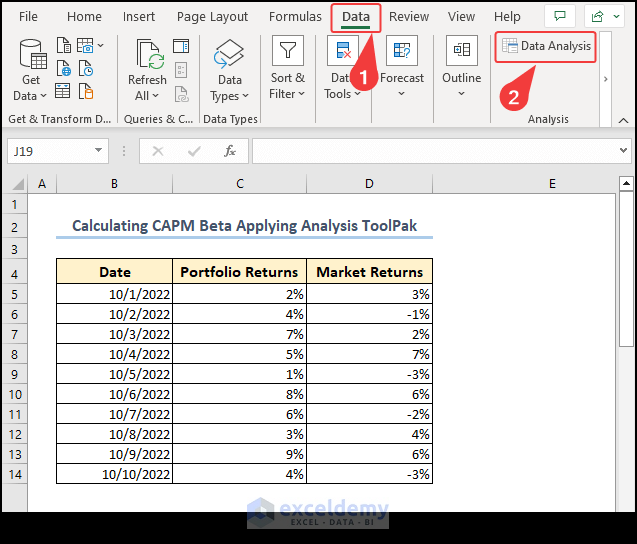
Method 2 – Applying the Analysis ToolPak to Calculate CAPM Beta
- Select the Data tab and go to Data Analysis.
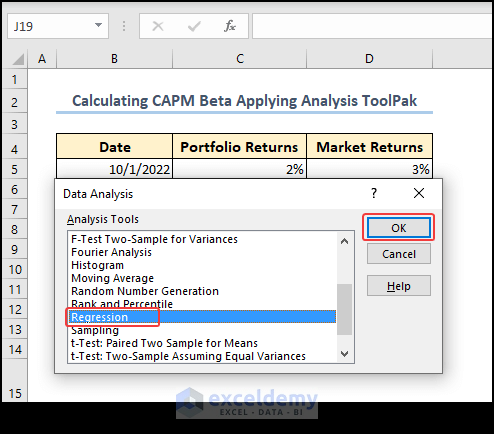
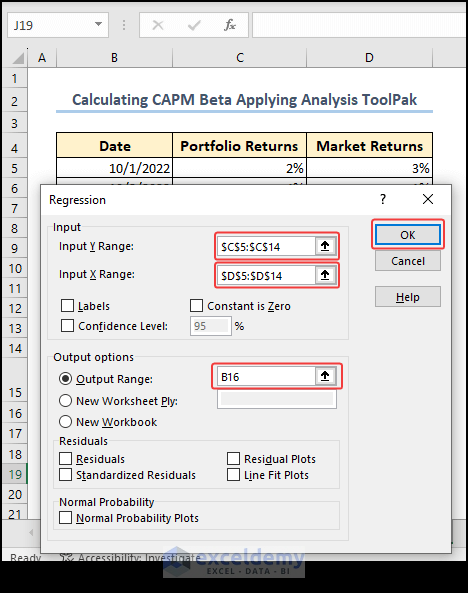
- Select the Regression option from the Data Analysis tab.
- From the Regression tab, enter the reference range for data of Portfolio Returns and Market Returns in the Input Y Range and Input X Range sections, respectively. Select the range for output in the Output Range section.
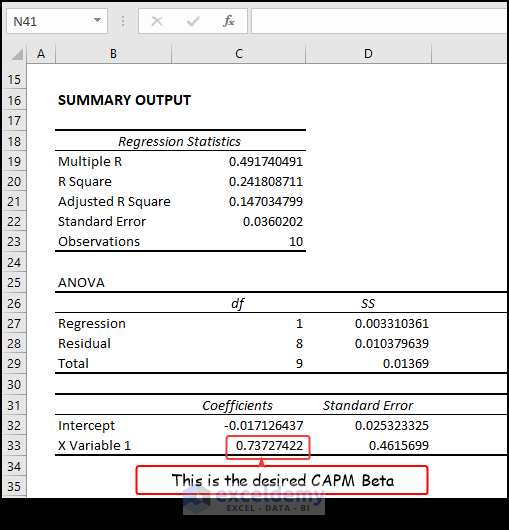
- After pressing OK, you will see the various analysis results in the worksheet. CAPM Beta is one of them.
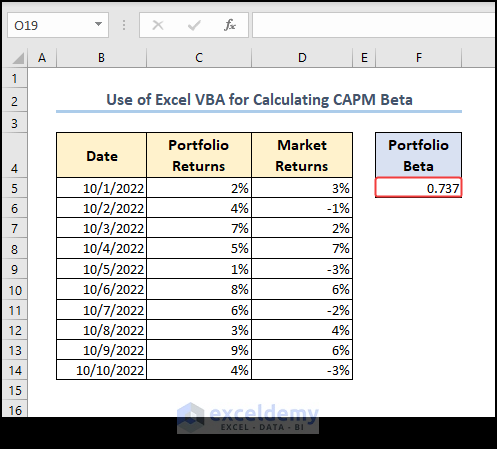
Method 3 – Use Excel VBA to Calculate CAPM Beta
- Open the VBA window by pressing Alt + F11. You can also select the Developer tab > Visual Basic.
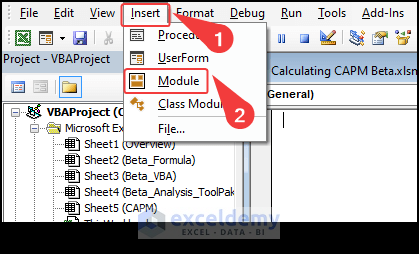
- Select Insert > Module to open a new code module.
- Use the attached code in the module and run it.
Code:
Sub Beta_VBA()
Dim P_Returns As Range
Dim M_Returns As Range
Dim Covariance As Double
Dim Variance As Double
Dim Beta As Double
Set P_Returns = Worksheets("Beta_VBA").Range("C5:C14")
Set M_Returns = Worksheets("Beta_VBA").Range("D5:D14")
Covariance = WorksheetFunction.Covariance_P(P_Returns, M_Returns)
Variance = WorksheetFunction.Var_P(P_Returns)
Beta = Covariance / Variance
Worksheets("Beta_VBA").Range("F5") = Beta
End Sub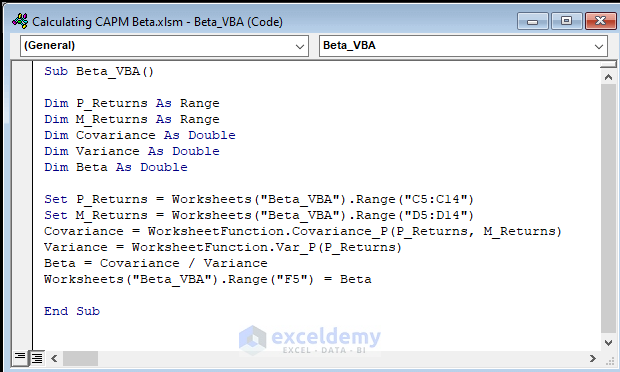
- You will the find the CAPM Beta in the worksheet.
Code Breakdown:
- We declared a sub-procedure and defined some necessary variables.
- We defined two ranges P_Returns and M_Returns as input ranges.
- We used the VBA Covariance_P function to get the covariance of data from ranges C5:C14 and D5:D14. We also used the VBA Var_P to get the variance of data from range C5:C14.
- We divided the covariance result by the variance result to get beta. We printed the result in the worksheet.
How to Use CAPM Beta to Get the Expected Return
We will use the following CAPM formula:
r = Rf + β * (Rm - Rf)
- r is expected return
- Rf is the risk-free rate
- β is the capm beta
- Rm is the expected market return (average).
Follow the steps to get Expected Return:
- We need to determine the average of the data from Market Returns:
=AVERAGE(D5:D14)
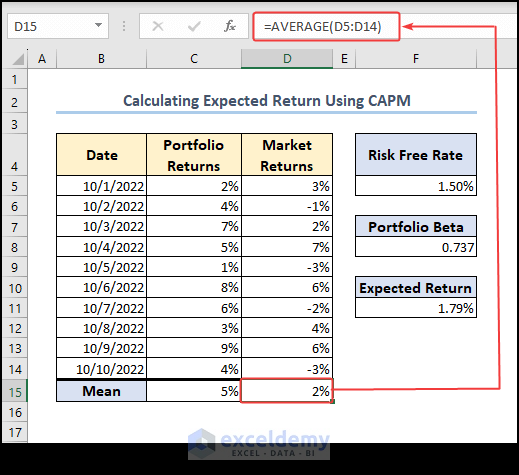
The AVERAGE function finds the average of data from the range D5:D14.
- Define a Risk-Free Rate for the calculation. We have taken 1.5% as a risk-free rate.
- Calculate the beta as we did before.
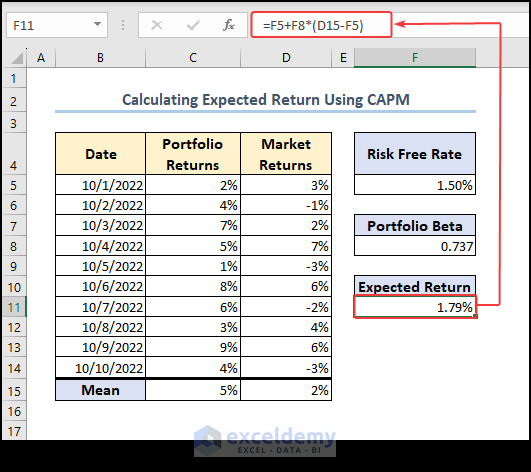
- Apply the following formula in a cell to calculate the Expected Return there.
=F5+F8*(D15-F5)
F5, F8, and D15 cells are risk-free rate, portfolio beta, and average market returns, respectively.
Frequently Asked Questions
How do we interpret beta values?
A beta of 1 indicates that an investment’s returns move in line with the standard returns, while a beta greater than 1 indicates that the investment is more volatile than the standard, and a beta less than 1 indicates that the investment is less volatile than the standard.
Can beta change over time?
Yes, beta can change over time due to changes in market conditions, company performance, and other factors. Investors should regularly reassess their holdings and adjust their portfolios as necessary to maintain their desired level of risk.
Things to Remember
- Be careful while dealing with cell references in the formula. In some cases, we used absolute cell references with the “$” sign.
- Change the Risk-Free Rate according to your needs.
- Don’t forget to save the file as an .xlsm file before running VBA macro.
Download the Practice Workbook
Related Articles
- How to Add Stock Data Type in Excel
- [Solved]: Data Types Stocks and Geography Missing Problem in Excel
- How to Download Historical Stock Data into Excel
<< Go Back to Stocks In Excel| Excel for Finance | Learn Excel
Get FREE Advanced Excel Exercises with Solutions!
