Safety Stock
Safety stock acts as a buffer to ensure that a company can meet customer demand even during unexpected fluctuations in demand or lead time. Here’s how to calculate it:
- Definition: Safety stock is the extra inventory a company keeps on hand to mitigate the risk of stockouts.
- Factors Affecting Safety Stock:
- Demand variability
- Lead times
- Supplier performance
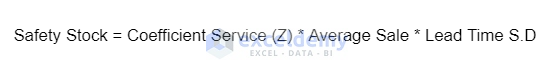
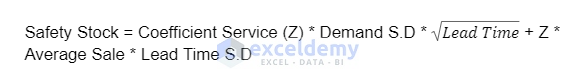
- Formula for Safety Stock:
- Safety Stock = Average Sales * Lead Time
Reorder Point
The reorder point represents the minimum inventory level at which a new order should be placed. It prevents stockouts while minimizing excess inventory costs. Here’s how to calculate it:
- Definition: Reorder point is the inventory level before placing a new order.
- Factors Affecting Reorder Point:
- Expected demand
- Lead time
- Safety stock (for demand and supply variability)
- Formula for Reorder Point:
- Reorder Point = Safety Stock + (Average Sales * Lead Time)
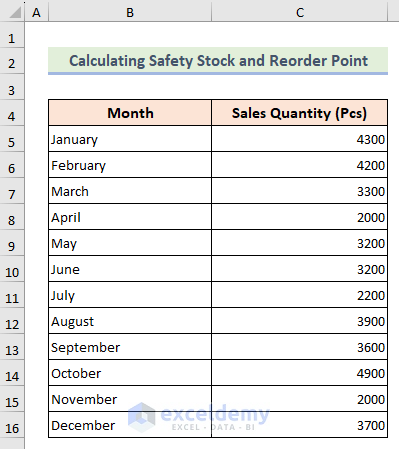
Dataset Overview
Let’s use a dataset of a shop’s sales quantity over several months.
Method 1 – Simple Arithmetic Formula
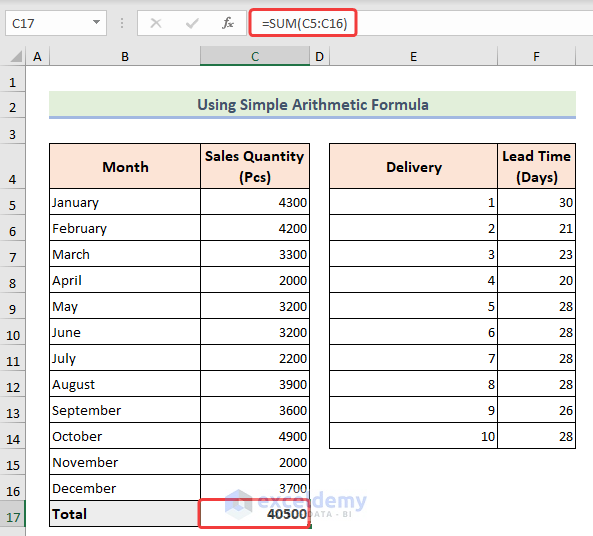
1. Calculate Total Quantity Sold
- Use the SUM function to add up the numerical values from the range C5:C16.
=SUM(C5:C16)
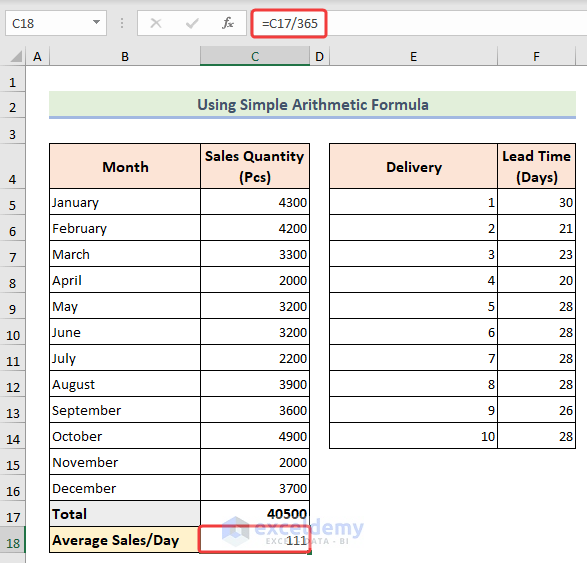
2. Average Sales Per Day
- Divide the total sales by 365 (assuming a year with 365 days):
=C17/365
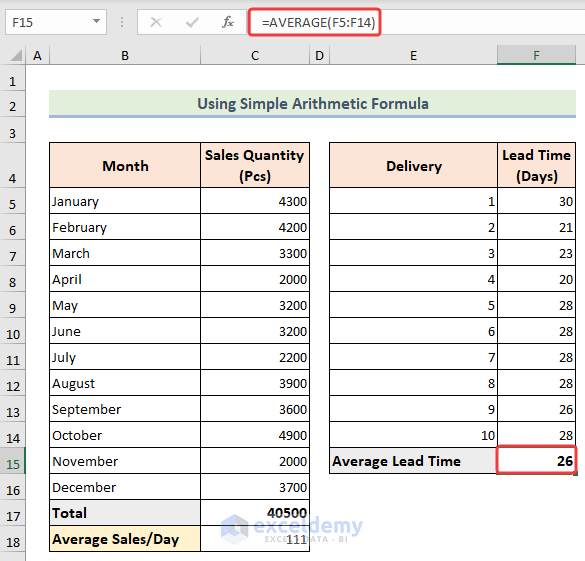
3. Average Lead Time
- Calculate the average lead time using the AVERAGE function for the data in F5:F14.
=AVERAGE(F5:F14)
4. Maximum Lead Time
- Determine the highest lead time using the MAX function for the data in F5:F14.
=MAX(F5:F14)
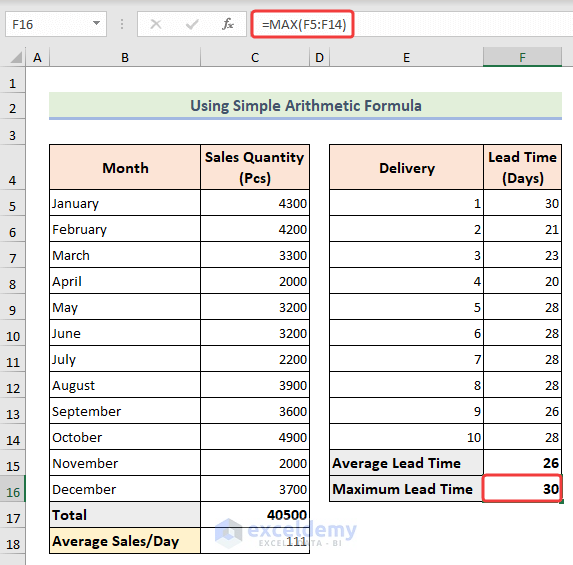
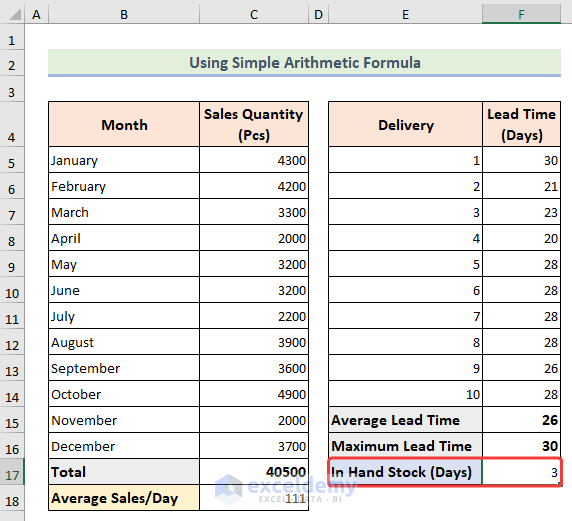
- From previous historical data, let’s assume we have 3 days of in-hand stock in our hands.
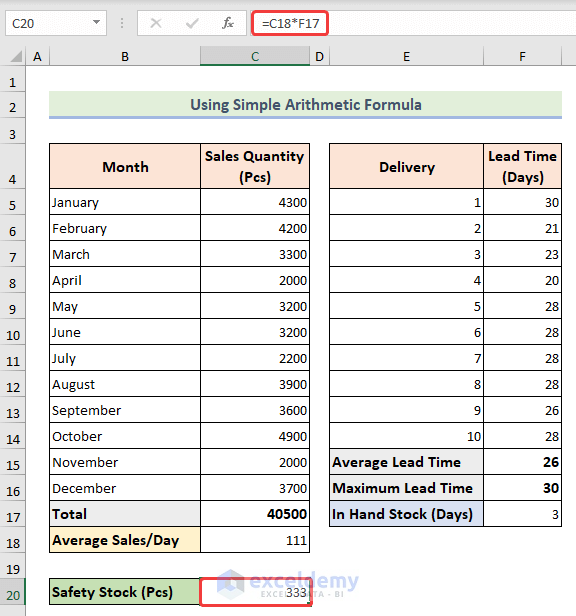
5. Safety Stock
- Compute safety stock using the basic formula:
=C18*F17
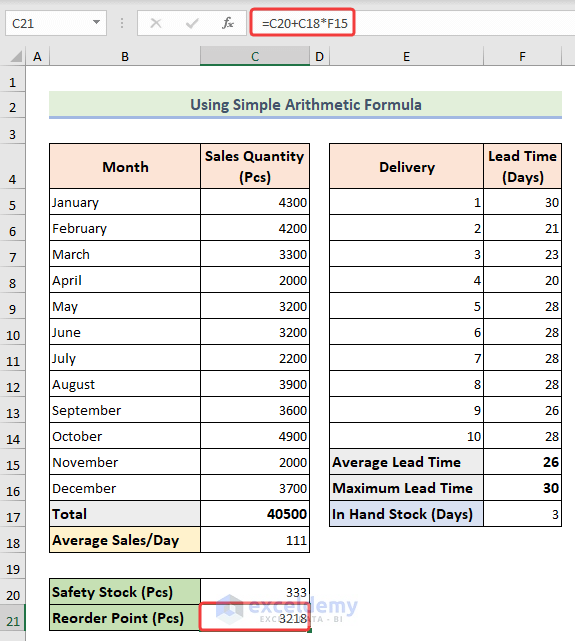
6. Reorder Point
- Calculate reorder point using:
=C20+C18*F15
We have successfully determined our safety stock and reorder point in Excel.
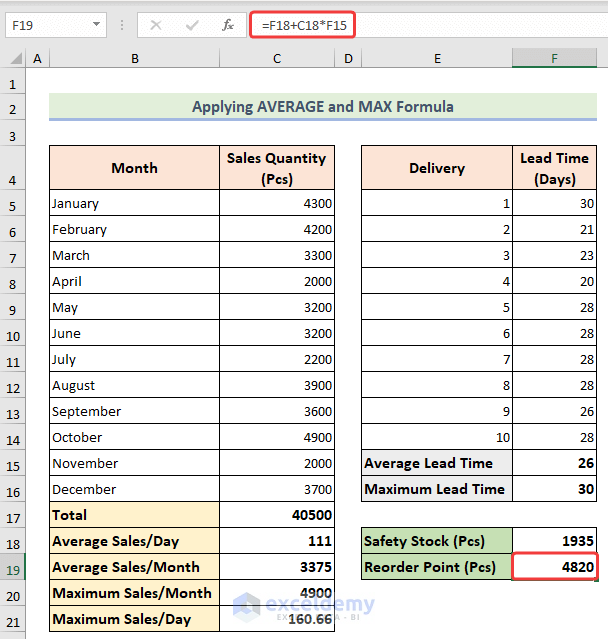
Method 2 – Applying AVERAGE and MAX Formula
This method considers worst-case scenarios of supply and demand variation. It combines the AVERAGE and MAX formulas:
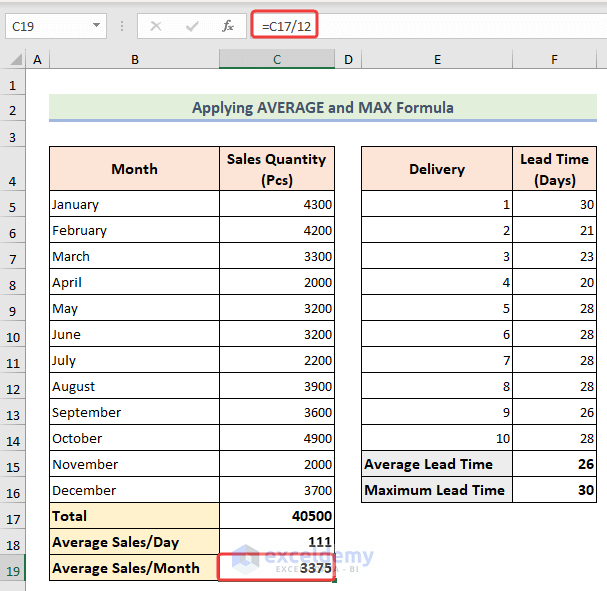
1. Month-Wise Average Sales
- In cell C19 divide the total sales by 12 to find the average sales per month:
=C17/12
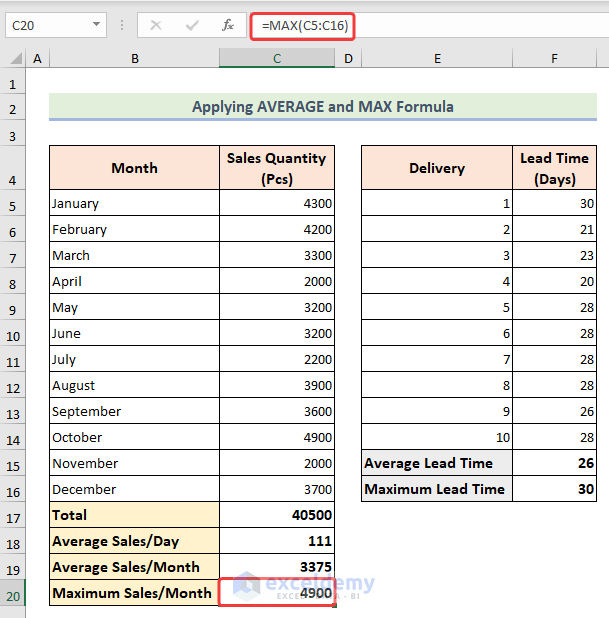
2. Maximum Sales for the Month
- Use the MAX formula for the data in
=MAX(C5:C16)
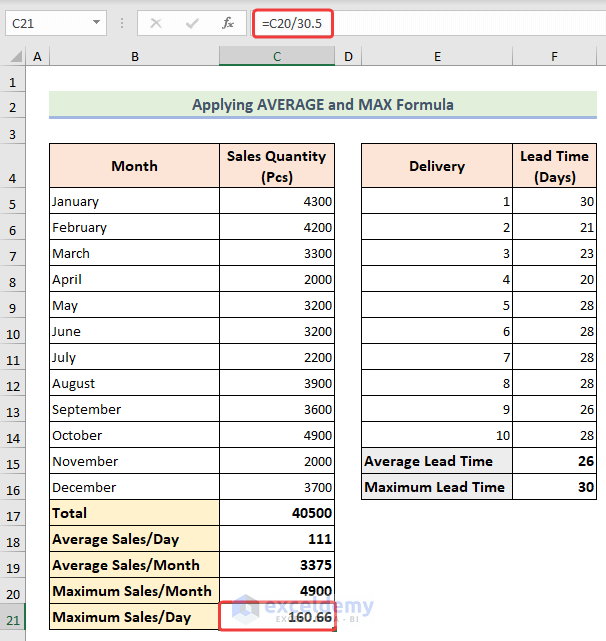
3. Maximum Sales Per Day
- Divide the maximum sales per month by 30.5 (approximating months to days).
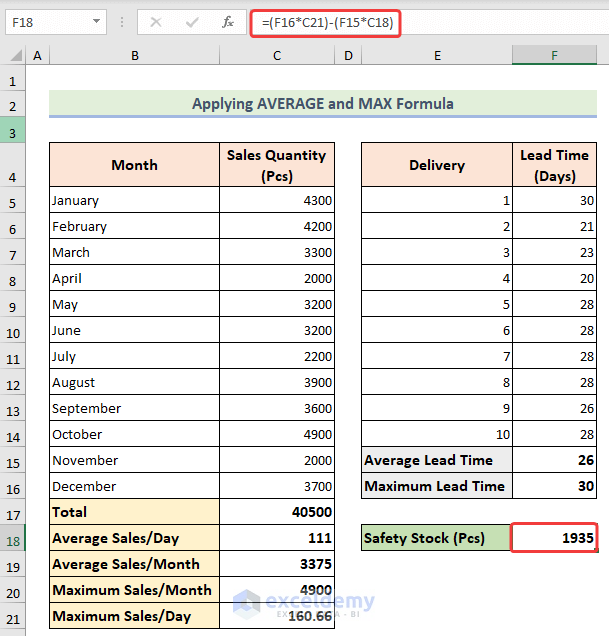
4. Safety Stock
- Calculate safety stock using:
Safety stock = (Max. lead time*Max. sales in a day) - (Avg. lead time*Avg. Sales in a day)
=(F16*C21)-(F15*C18)
5. Reorder Point
- Reorder point remains the same as in the previous method.
=F18+C18*F15
Keep in mind that this method may lead to higher inventory costs due to considering maximum sales and lead time. To be cautious, consider setting a percentage cap to account for possible delays in goods delivery.
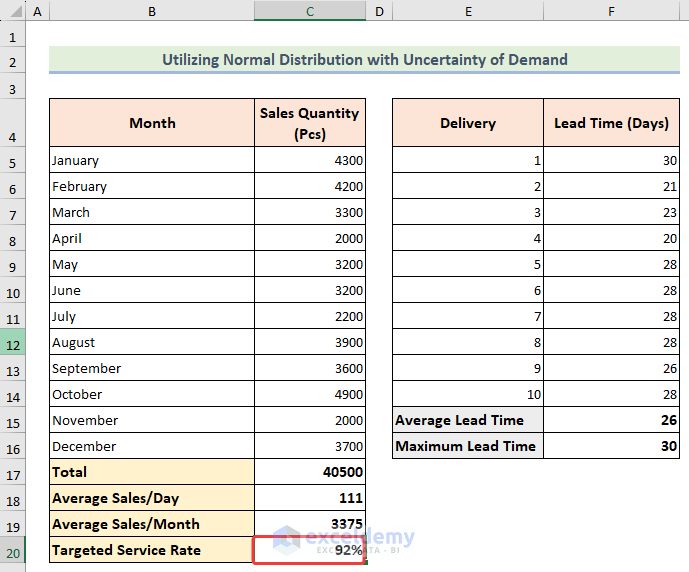
Method 3 – Using Normal Distribution with Uncertainty of Demand
If you want to customize your safety stock based on your preferred tolerance level, consider this method. Here’s how to proceed:
Let’s assume we want a service rate of 92% for keeping safety stock.
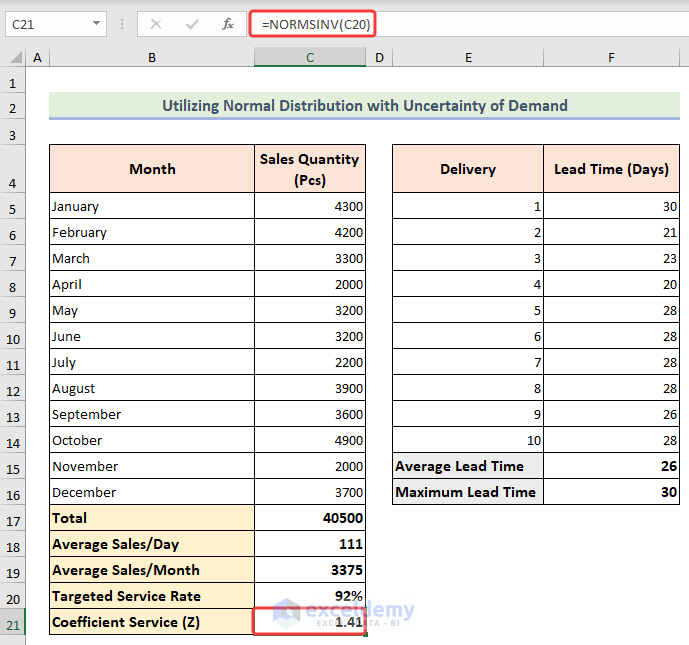
1. Coefficient of Service (z)
- Determine the coefficient of service using the NORMSINV function. This function calculates the inverse of the normal cumulative distribution based on a given probability.
- Insert this formula in cell C21:
=NORMSINV(C20)
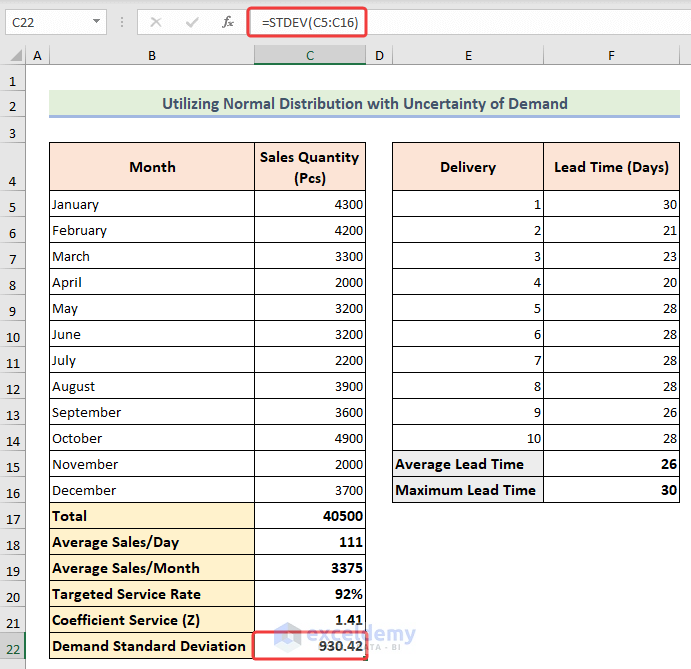
2. Demand Standard Deviation
- Find the standard deviation for demand using the STDEV function for the data in C5:C16.
=STDEV(C5:C16)
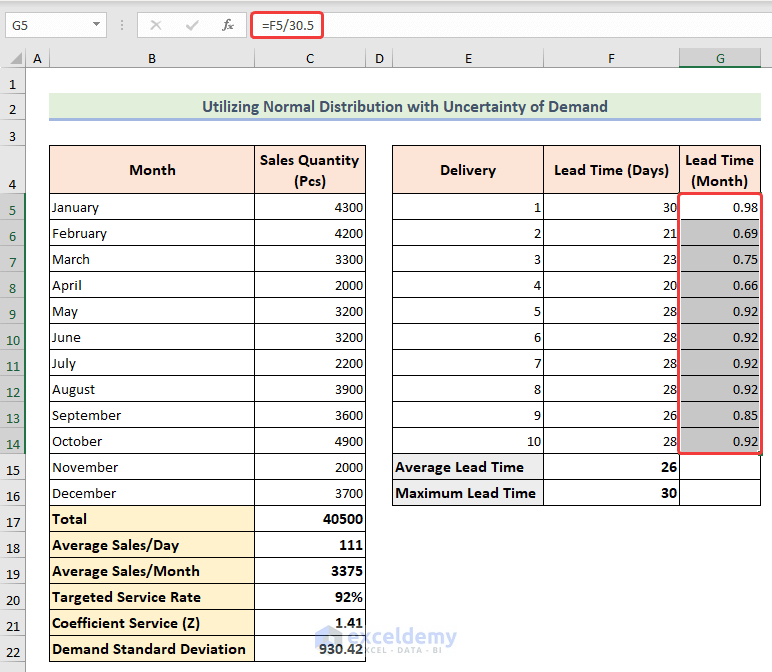
3. Lead Time Conversion
- Convert lead time to months by dividing it by 30.5 (approximating months to days).
=F5/30.5
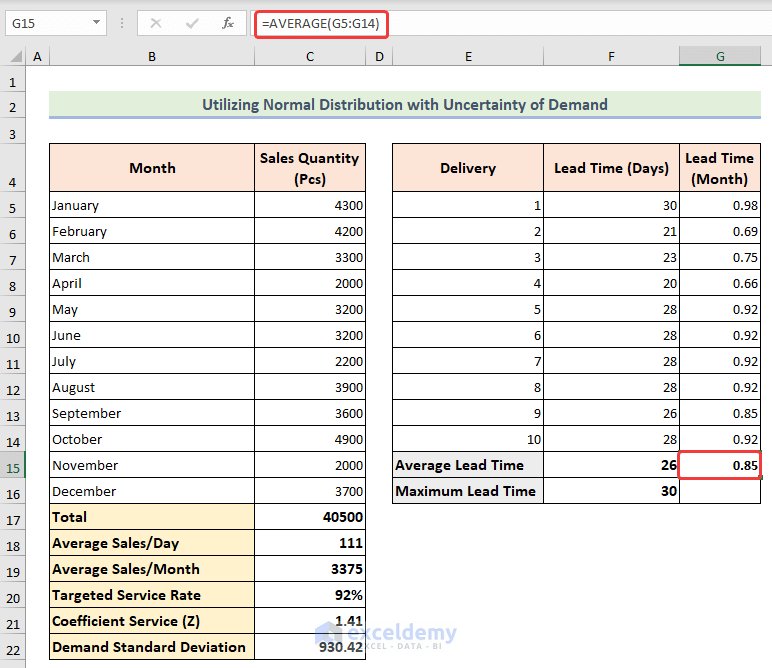
4. Average Lead Time
- Calculate the average lead time using the AVERAGE function for the data in G5:G14.
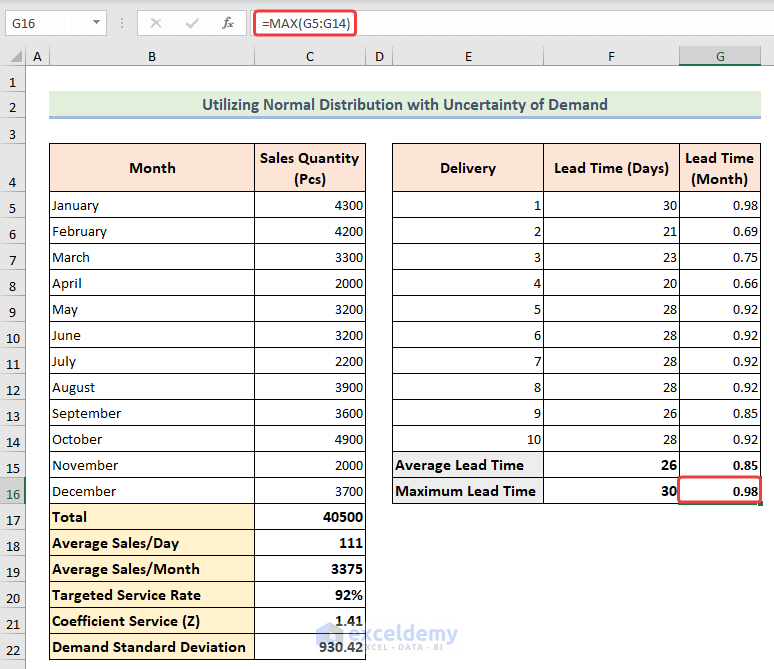
5. Maximum Lead Time
- Utilize the MAX function to compute the maximum lead time (similar to previous methods).
=MAX(G5:G14)
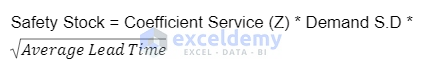
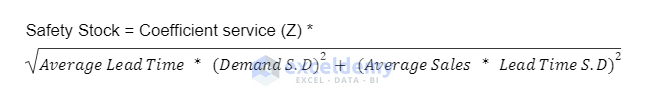
6. Safety Stock Calculation
- Multiply the coefficient of service, uncertain demand, and the square root of lead time (SQRT function).
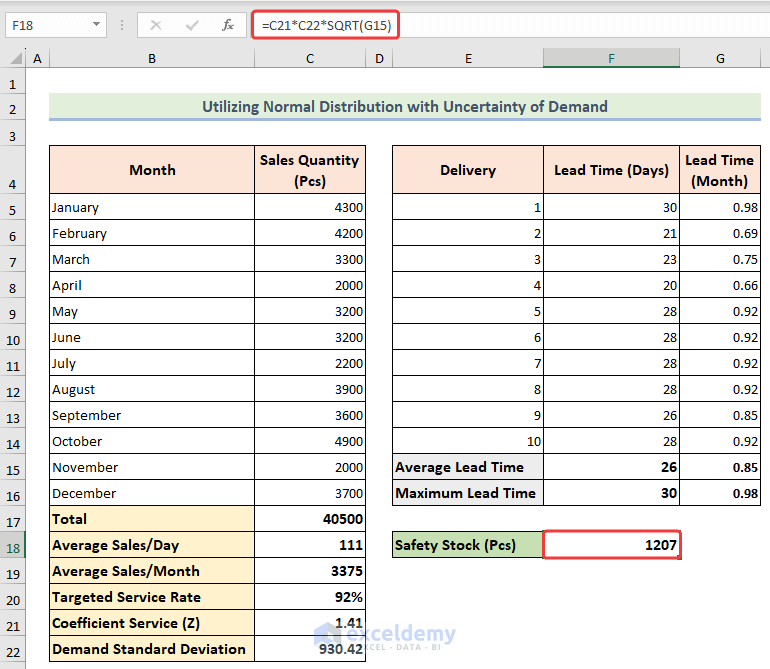
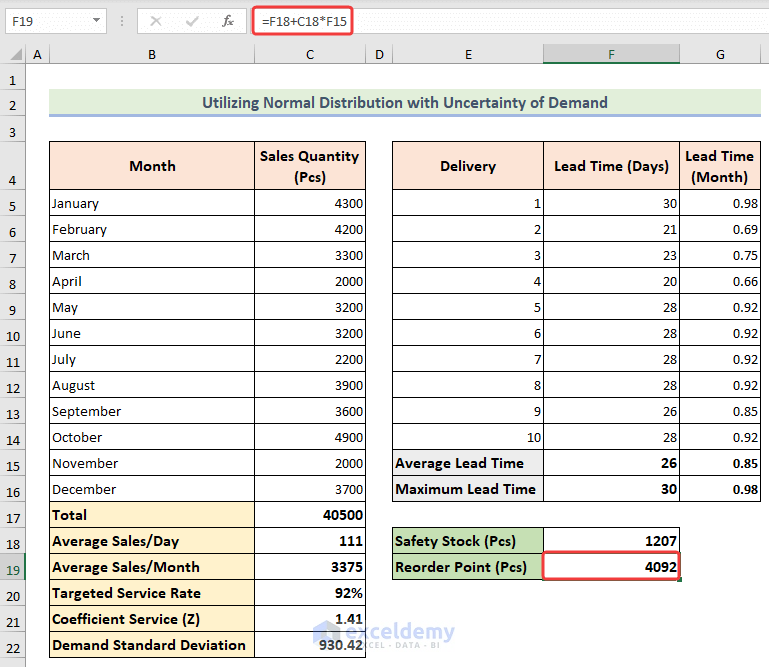
7. Reorder Point
- The formula for reorder point remains the same as in the previous methods.
=F18+C18*F15
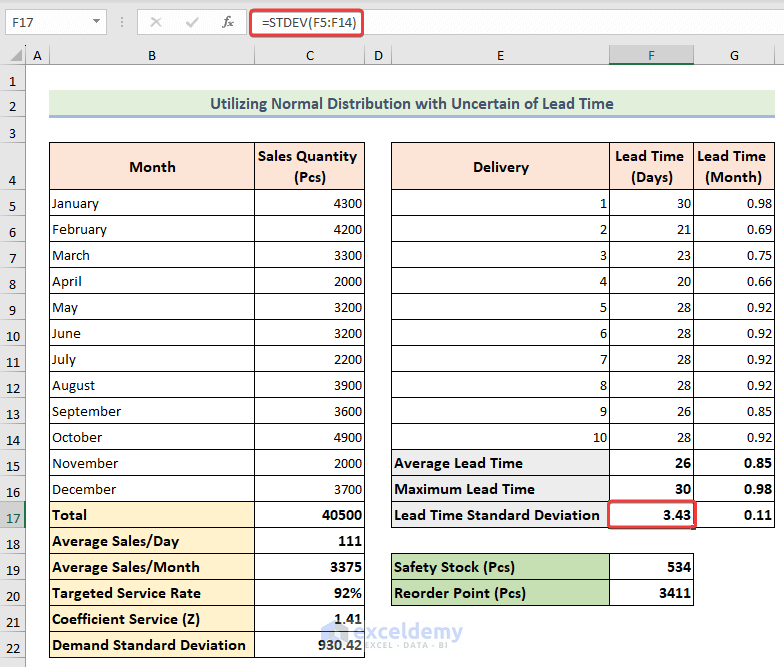
Method 4 – Using Normal Distribution with Uncertainty of Lead Time
In this scenario, we consider uncertainty in suppliers’ lead time. Let’s find the standard deviation for lead time:
1. Lead Time Standard Deviation
- Calculate the standard deviation for lead time using the STDEV function for the data in
- Select a cell (F17) and put the below formula down-
=STDEV(F5:F14)
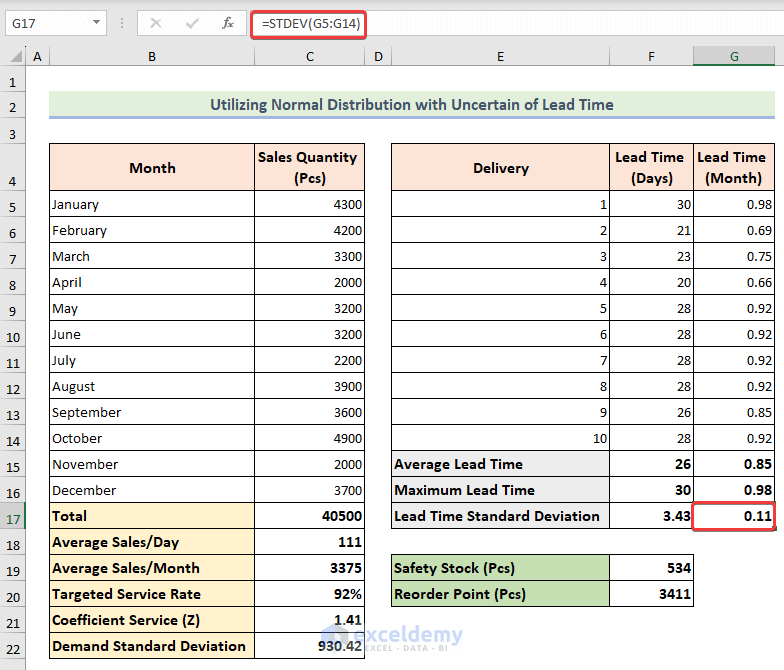
2. Lead Time Standard Deviation (Month-Wise)
- Similarly, compute the lead time standard deviation month-wise using the STDEV function for the data in G5:G14.
=STDEV(G5:G14)
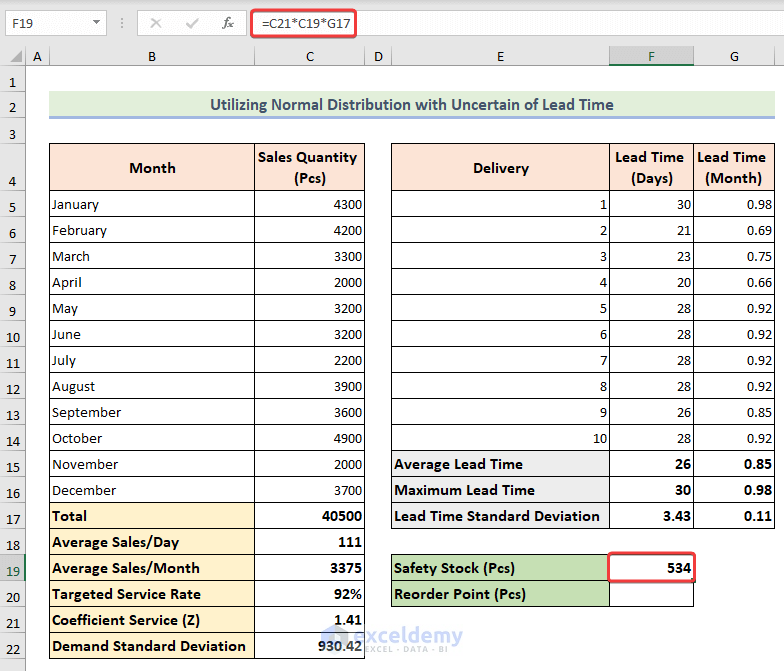
3. Safety Stock Calculation
- Multiply the coefficient of service, average sales, and lead time standard deviation:
=C21*C19*G17
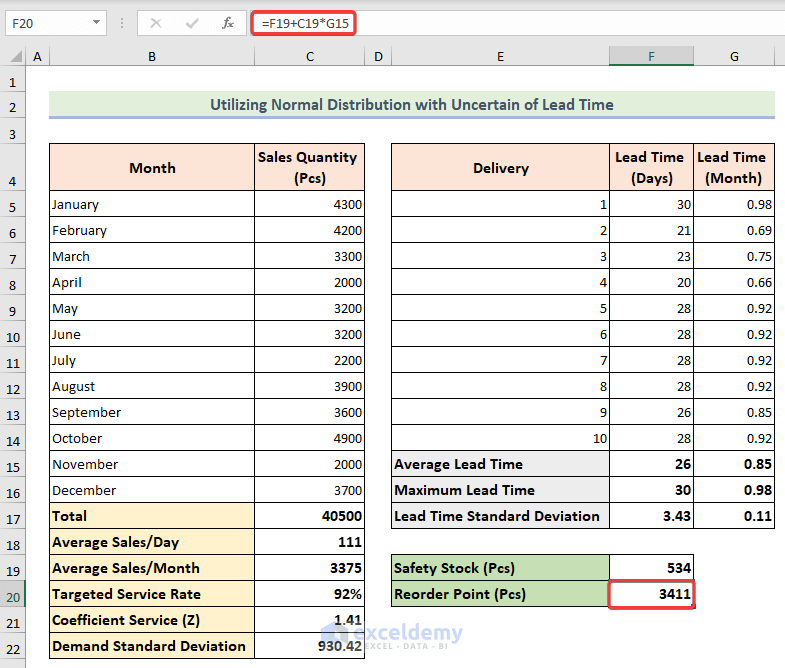
4. Reorder Point
- Use the same formula for reorder point as in the previous methods.
=F19+C19*G15
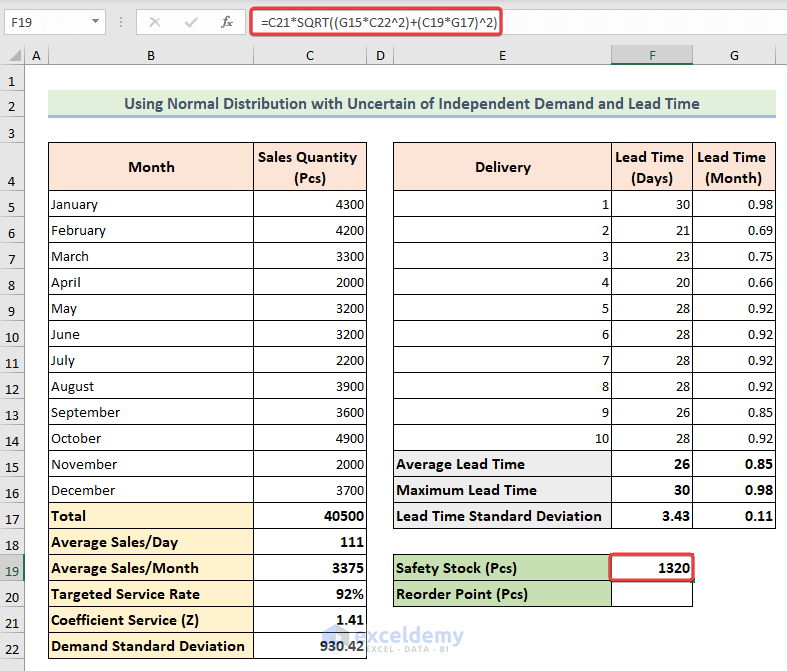
Method 5 – Using Normal Distribution with Uncertain of Independent Demand and Lead Time
In challenging scenarios where both demand and lead time are uncertain, you can use this method. Here’s how:
1. Coefficient of Service (Z)
- Determine the coefficient of service using the NORMSINV function. This function calculates the inverse of the normal cumulative distribution based on a given probability.
- In cell (F19) enter the following formula:
=C21*SQRT((G15*C22^2)+(C19*G17)^2)
2. Demand Standard Deviation
- Find the standard deviation for demand using the STDEV function for the data in C5:C16.
=F19+C19*G15
3. Lead Time Conversion
Convert lead time to months by dividing it by 30.5 (approximating months to days).
=F5/30.5
4. Average Lead Time
- Calculate the average lead time using the AVERAGE function for the data in G5:G14.
5. Maximum Lead Time
- Utilize the MAX function to compute the maximum lead time (similar to previous methods).
6. Safety Stock Calculation
- Multiply the coefficient of service, uncertain demand, and the square root of lead time.
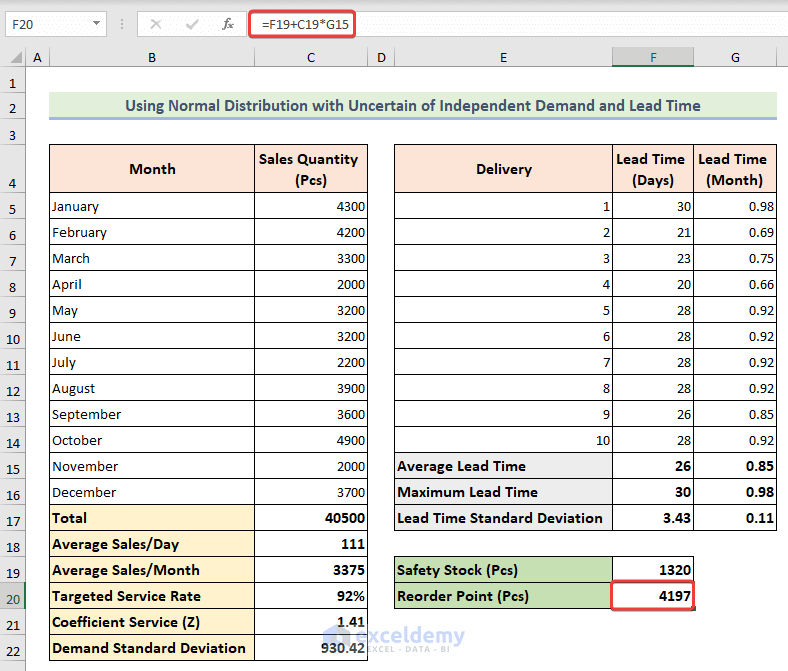
7. Reorder Point
- The formula for reorder point remains the same as in the previous methods.
=F19+C19*G15
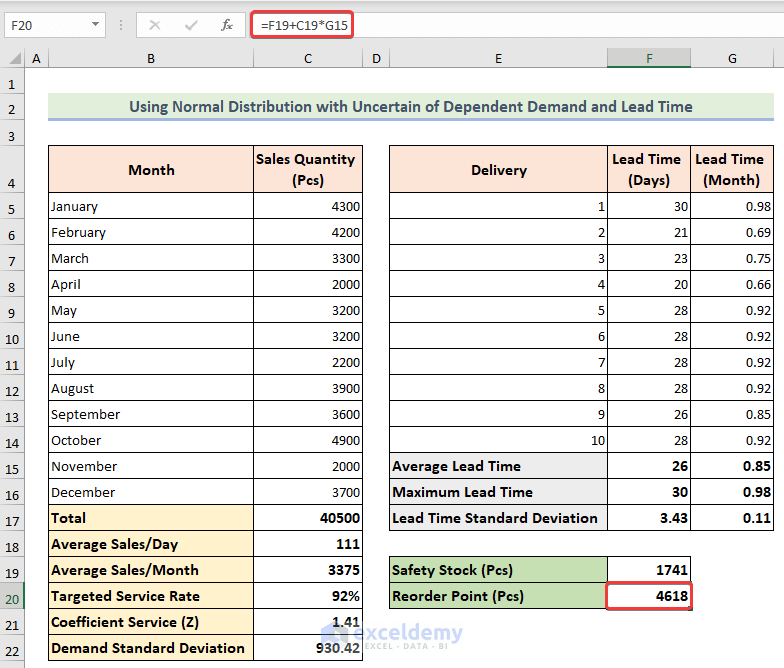
Method 6 – Using Normal Distribution with Uncertainty of Dependent Demand and Lead Time
In this final method, we consider both lead time and demand as dependent variables. Use the following formula, where we multiply uncertain demand and lead time with other factors:
1. Safety Stock Calculation
- Multiply the coefficient of service, average sales, and lead time standard deviation.
- Choose a cell (F19) and insert the below formula and click ENTER.
=C21*C22*SQRT(G15)+C21*C19*G17

2. Reorder Point
- Use the same formula for reorder point as in the previous methods.
=F19+C19*G15
Why Do We Calculate Safety Stock and Reorder Point in Excel?
Safety stock and reorder points play critical roles in inventory management. Let’s break it down:
- Safety Stock:
- Acts as a buffer against demand and supply fluctuations.
- Prevents stockouts caused by unexpected events.
- Essential for maintaining smooth operations.
- Reorder Point:
- Determines when to replenish inventory.
- Optimizes planning, reduces costs, and aligns purchasing and production processes.
By implementing and maintaining safety stock and reorder points, you can enhance your overall inventory management system.
Which Formula to Choose for Calculating Safety Stock in Excel?
- Consider your business needs and characteristics.
- Tips:
- For a few product types with low volume, try the Average and Max Method.
- For diverse product ranges and higher volume, explore normal distribution methods with uncertainty of demand and lead time.
- When lead time data is lacking, consider the Normal Distribution with Uncertainty of Demand.
Things to Remember
- Ensure consistent units of measurement when applying formulas.
Frequently Asked Questions
- Factors to Consider:
- Demand variability, lead time variability, service level targets, and inventory holding costs.
- Recalculation Frequency:
- Depends on demand and lead time stability.
- Excel for Multiple Products:
- Yes, use separate worksheets or columns for each product.
- Other Methods for Safety Stock:
- Service level approach, historical data analysis, and simulation modeling.
Download Practice Workbook
You can download the practice workbook from here:
Get FREE Advanced Excel Exercises with Solutions!

This was simple to understand. Thanks.
Hello Tamiko,
You are most welcome.
Regards
ExcelDemy