Method 1 – Using COVARIANCE & VARIANCE Functions to Calculate Beta in Excel
Steps:
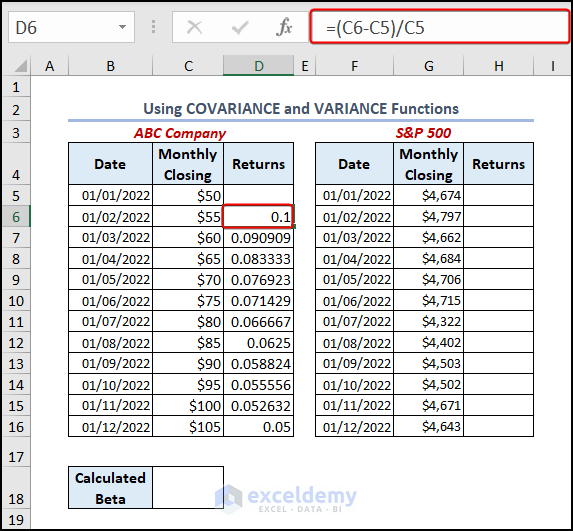
- Go to cell D6, and enter the below formula.
=(C6-C5)/C5C5 is the initial value of the stock and C6 is the present value of stock
The output gives you the returns on your stock price. We have to leave the initial price of the stock.
- Press ENTER, and drag it down for the other cells with the Fill Handle tool.
- Calculate the returns of the market value following the same process.
- Insert the below formula in the H6 cell.
=(G6-G5)/G5G5= Initial price of the overall market.
G6= Present price of the overall market.
We subtracted the initial value from the final value and divided it by the initial value.
- Press ENTER, and drag it down for other cells.

- We need to calculate the beta. Insert the below formula in cell C18.
=COVARIANCE.P(D6:D16,H6:H16)/VAR.P(H6:H16)COVARIANCE.P(D6:D16, H6:H16) estimates the covariance between D6:D16 and H6:H16. We divided the value by VAR.P(H6:H16) where VAR.P calculates the variance of H6:H16 cells, which is the market’s return value.
- Press ENTER to get the beta of your stock.
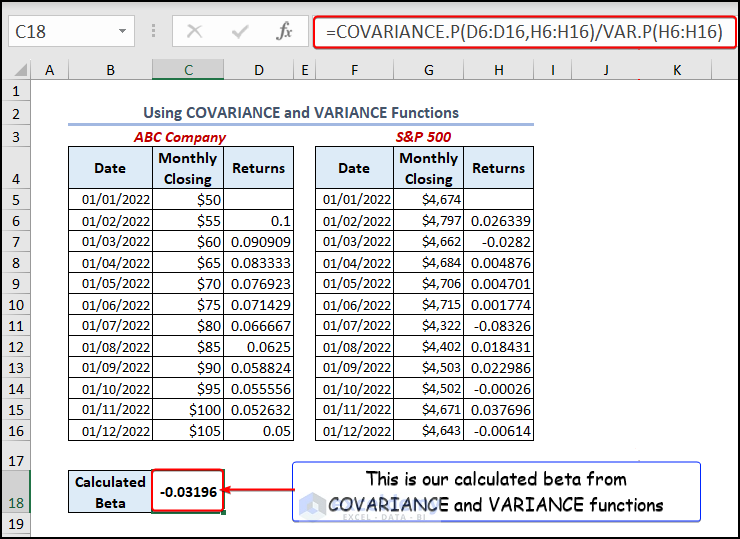
In the image below you can see that the beta is -0.03196. The negative sign indicates that your stock behaves oppositely in contrast with the overall market. In other words, when the market value goes up, the stock price of our dataset will fall down, and vice-versa.
Method 2 – Using SLOPE Function to Determine Beta
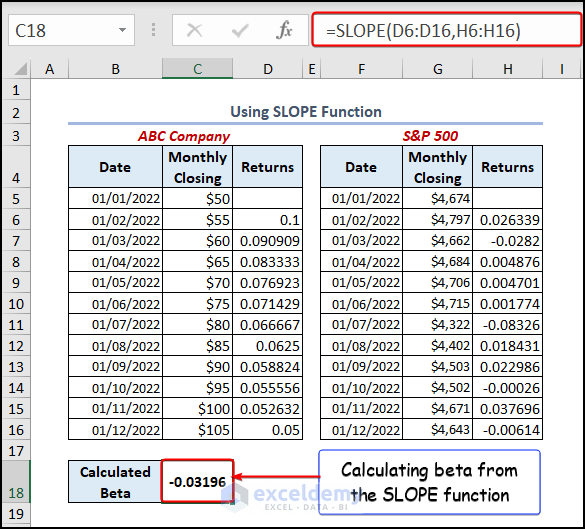
The SLOPE function refers to the linear regression of a straight line. It also estimates the covariance between the stock returns and the market returns by multiplying the deviations of each data point from their respective means and taking the average of the resulting products. The formula we have used here is stated below.
=SLOPE(D6:D16,H6:H16)The SLOPE function calculates the linear regression that best fits the data in cells D6:D16 (dependent variable) and the data in cells H6:H16 (independent variable).
- Press ENTER, and you have calculated the beta for your dataset. The output is shown in the below image.
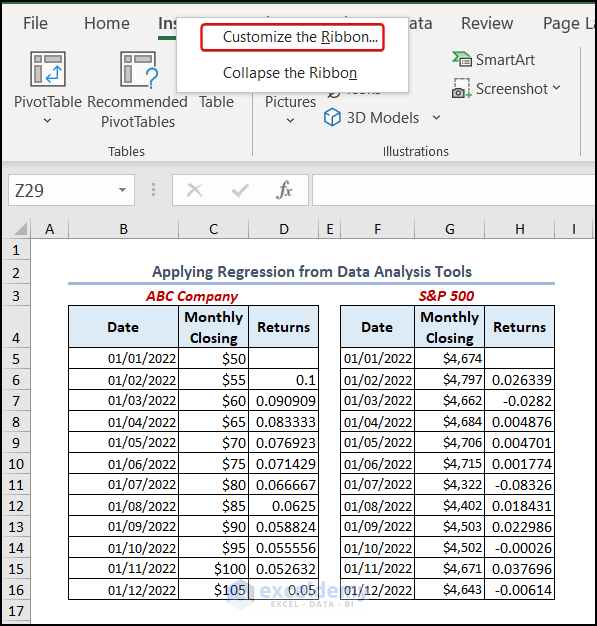
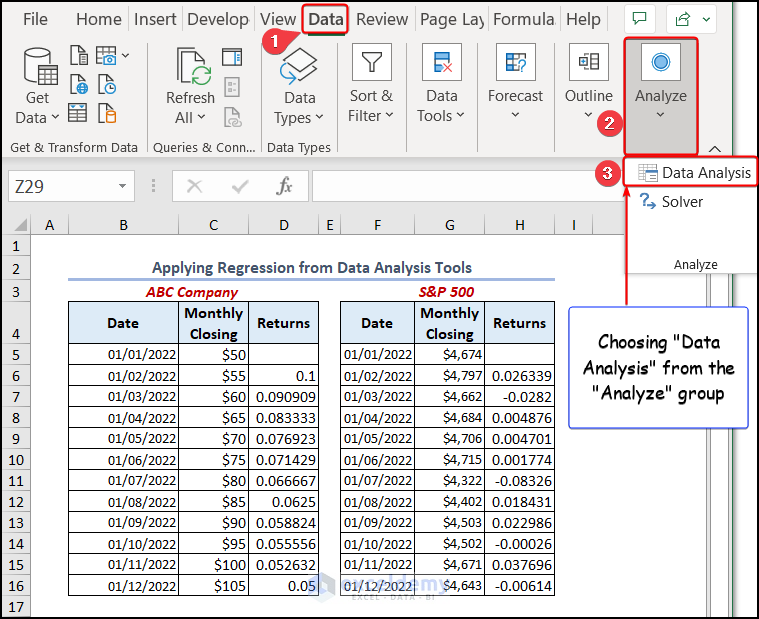
Method 3 Applying Regression from Data Analysis Tools
Steps:
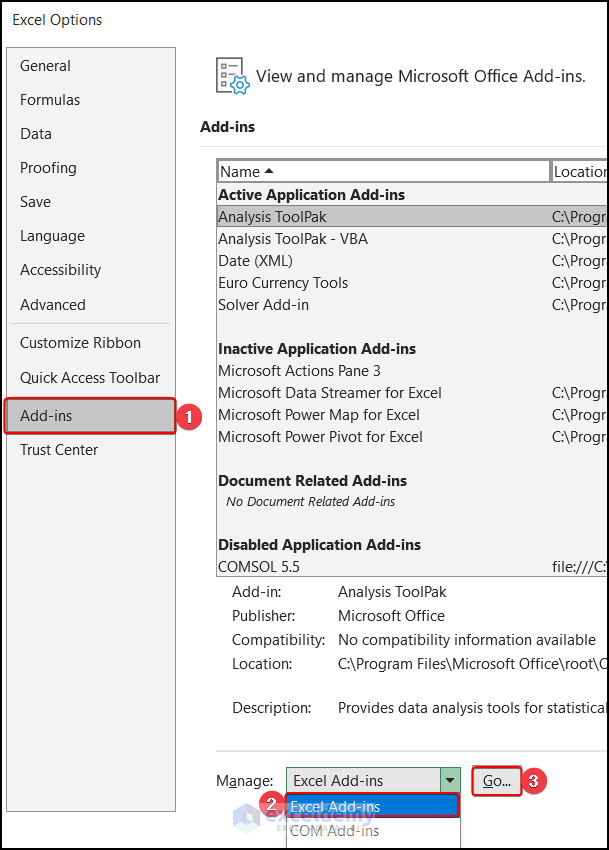
- Right-click on the ribbon and choose the Customize the Ribbon option. It will open the Excel Options.
- In the Excel Options window, select Add-ins. Choose the Excel Add-ins from the Manage group and hit Go.
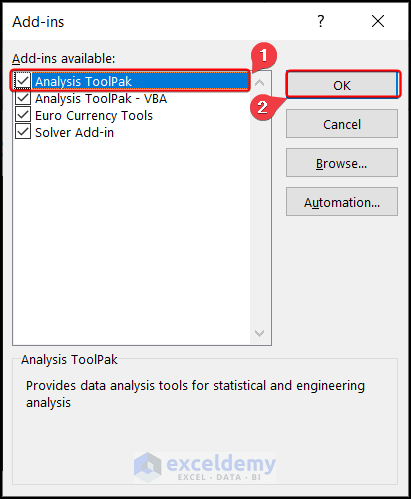
- Add-ins window select the Analysis ToolPak box and click OK.
- Navigate to the Data tab >> from the Analyze group, pick the Data Analysis.
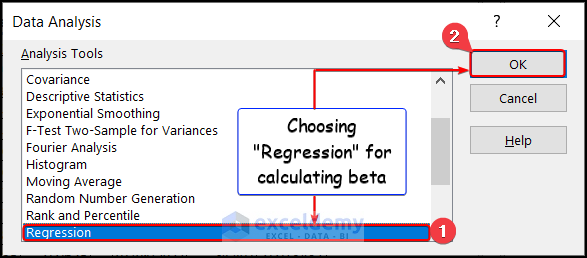
- The Data Analysis window appears. Select Regression from there and click OK.
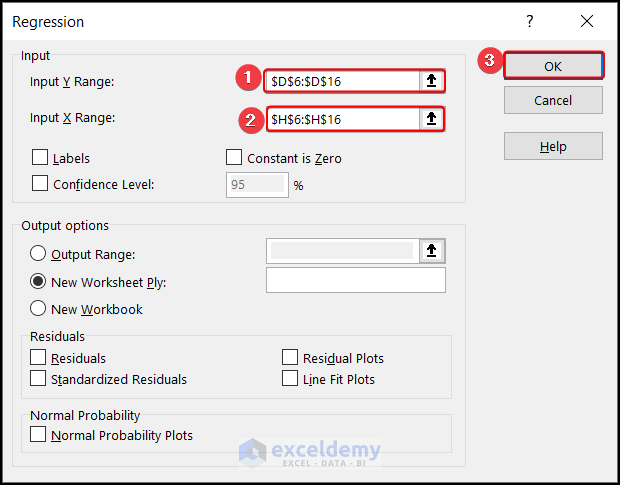
- The Regression window appears. Select $D$6:$D$16 in the Input Y Range and $H$6:$H$16 in the Input X Range. Click OK.
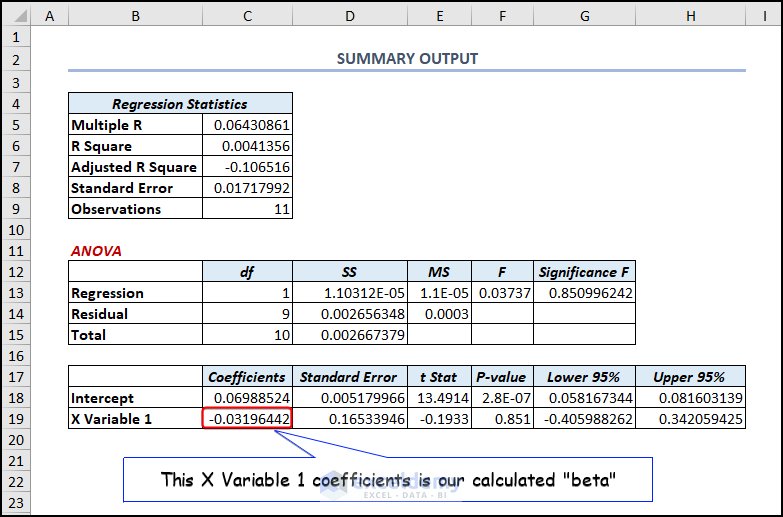
- A new sheet will be opened showing the regression result (See the below image). The Coefficients of X Variable 1 are our calculated beta.
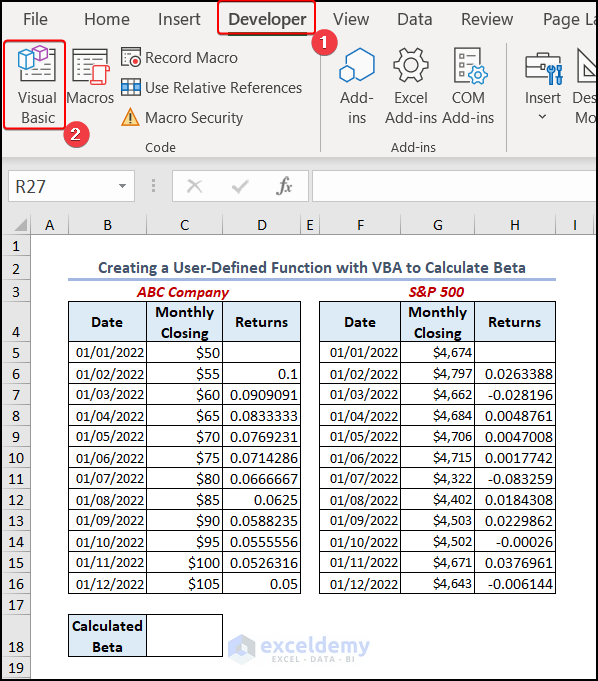
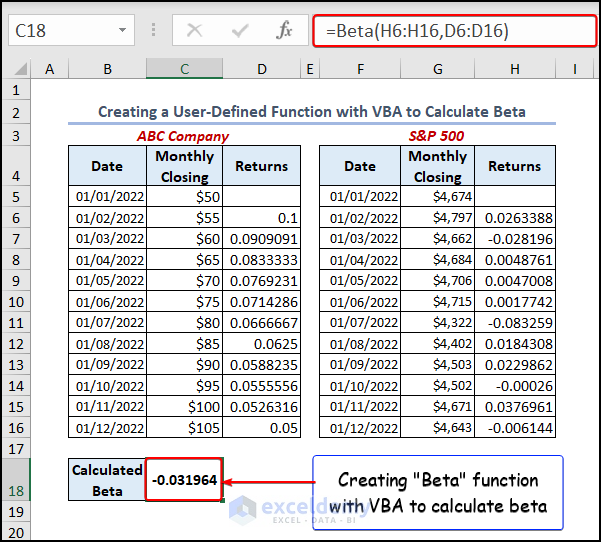
Method 4 – Creating a User-Defined Function with VBA to Calculate Beta
Steps:
- Hover over the Developer tab >> choose Visual Basic.
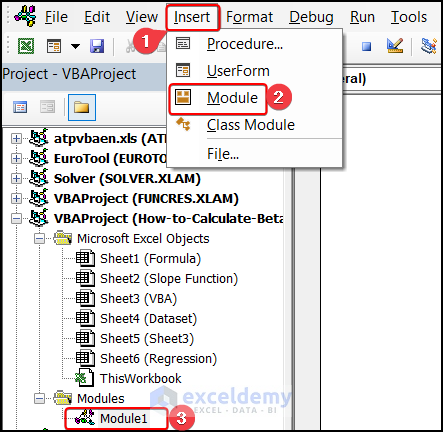
- The Visual Basic Editor window opens. Select the Insert tab >> Module >> Module1.
- Write the below VBA code there.
Function Beta(Range1 As Range, Range2 As Range) As Variant
'Calculate the Beta coefficient using linear regression
Dim X As Variant
Dim Y As Variant
Dim SumX As Double
Dim SumY As Double
Dim SumXY As Double
Dim SumX2 As Double
Dim SumY2 As Double
Dim n As Integer
Dim i As Integer
Dim Sxy As Double
Dim Sxx As Double
Dim Syy As Double
'Convert range values to arrays
X = Range1.Value
Y = Range2.Value
'Get the number of observations
n = UBound(X)
'Calculate the sums of X, Y, X*Y, X^2 and Y^2
For i = 1 To n
SumX = SumX + X(i, 1)
SumY = SumY + Y(i, 1)
SumXY = SumXY + X(i, 1) * Y(i, 1)
SumX2 = SumX2 + X(i, 1) ^ 2
SumY2 = SumY2 + Y(i, 1) ^ 2
Next i
'Calculate the slope and intercept coefficients
Sxy = SumXY - SumX * SumY / n
Sxx = SumX2 - SumX * SumX / n
Syy = SumY2 - SumY * SumY / n
Beta = Sxy / Sxx
End Function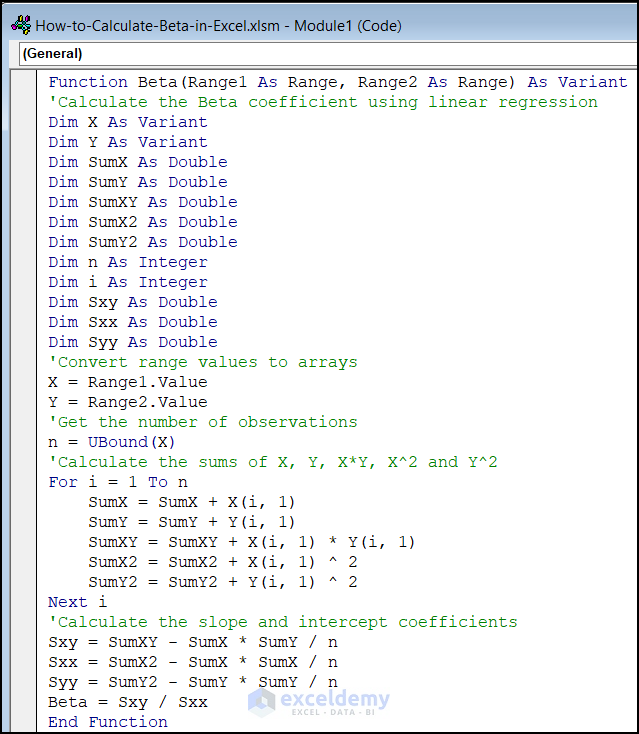
Code Breakdown:
- The function takes two arguments which are the two sets of data that will be used to calculate the beta coefficient.
- It takes a number of variables, including arrays for the X and Y values. There are variables for the sums of X, Y, X*Y, X², and Y².
- It estimates the sums of X, Y, X*Y, X², and Y² through the iteration of For Loop.
- The sums the function then calculates the slope and intercept coefficients of the linear regression line.
- The function finds the beta by dividing the slope coefficient (Sxy/Sxx).
Go to your worksheet and select any cell where you want to put the formula. In our dataset, we entered the formula in the C18 cell. The formula is:
=Beta(H6:H16,D6:D16)The “Beta” is a user-defined function. It takes Range1 as the first argument, which is the independent variable array, and Range2 as the second argument, which is the dependent variable array.
- Press ENTER to get the output.
Frequently Asked Questions
- Is beta a percentage?
Answer: A statistical measure of a company’s stock price’s volatility in relation to the entire stock market is called beta. It is computed by regressing a stock’s or portfolio’s percentage change against the market’s percentage change.
- Is beta the risk-free rate?
Answer: A risk-free asset has a beta of 0 since its covariance with the market is also zero. The market’s beta is one by definition, and the majority of developed market equities have strong positive betas.
- What does a beta value of 0.8 mean?
Answer: A stock with a beta of 0.8 is predicted to perform 80% better than the market as a whole. A stock’s movement would be 20% more than the market’s movement if its beta was 1.2.
Things to Remember
- To calculate beta, you need data for both the stock or portfolio you are analyzing and the market index you are using as a benchmark. Make sure that you have the correct data and that it covers the same time period.
- The stock price and the market price should have the same frequency whether it is daily, weekly, or monthly data. You need to convert it in the same time period and the same frequency.
- To calculate beta, you need to find the returns of the stock, not the price. You can keep the returns in percentage forms.
Download Practice Workbook
Download the following practice workbook. It will help you understand the topic more clearly.
Related Articles
- How to Add Stock Data Type in Excel
- [Solved]: Data Types Stocks and Geography Missing Problem in Excel
- How to Download Historical Stock Data into Excel
<< Go Back to Stocks In Excel| Excel for Finance | Learn Excel
Get FREE Advanced Excel Exercises with Solutions!

