Method 1 – Calculate Cronbach’s Alpha in Excel
Steps:
- Go to Data >> Data Analysis >> Anova: Two Factor Without Replication and click on OK.
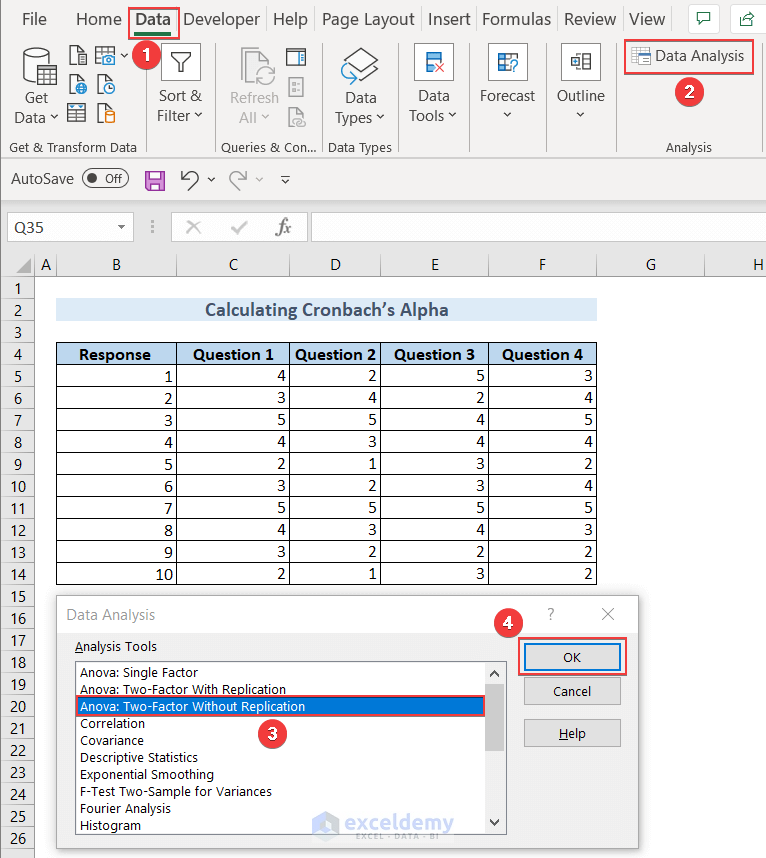
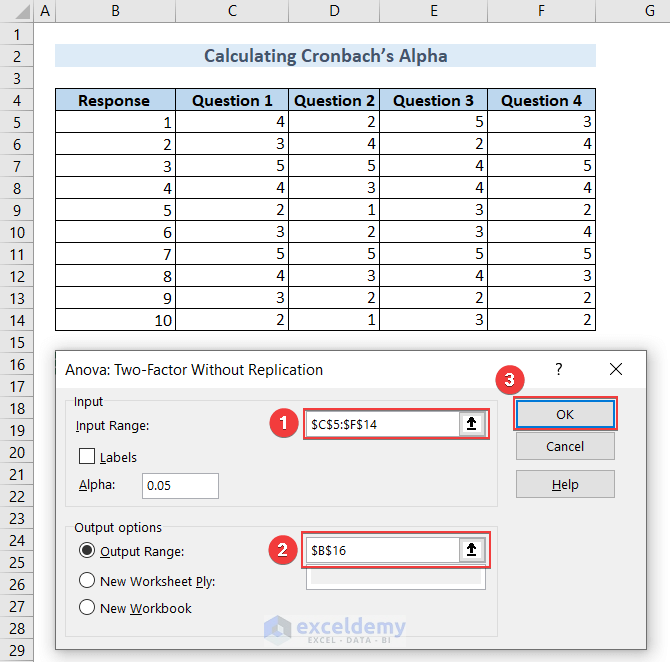
The Anova: Two Factor Without Replication window will pop up.
- Type $C$5:$F$14 in the Input Range: to populate the dataset and $B$16 in Output Range: to get the output and click OK.
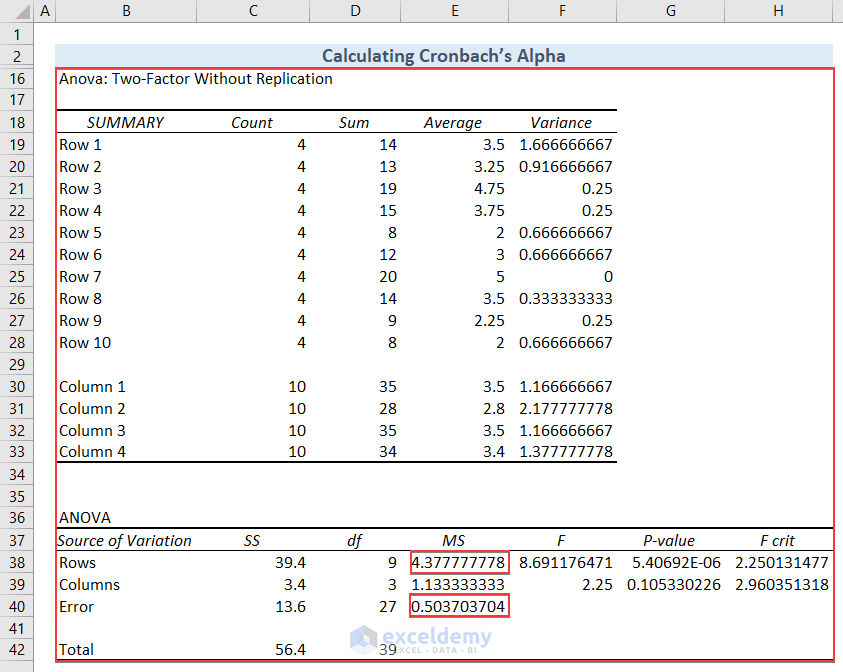
We’ll get the details of Anova: Two-Factor Without Replication data starting from cell B16.
Use the data in cell E38, which is MS for Rows, and in cell E40, which is MS Error, to calculate Cronbach’s Alpha.
- Type the formula in cell B45 and hit ENTER to get Cronbach’s Alpha. I’ve shown the formula in cell C45 using the FORMULATEXT function so that you can understand it.
=1-(E40/E38)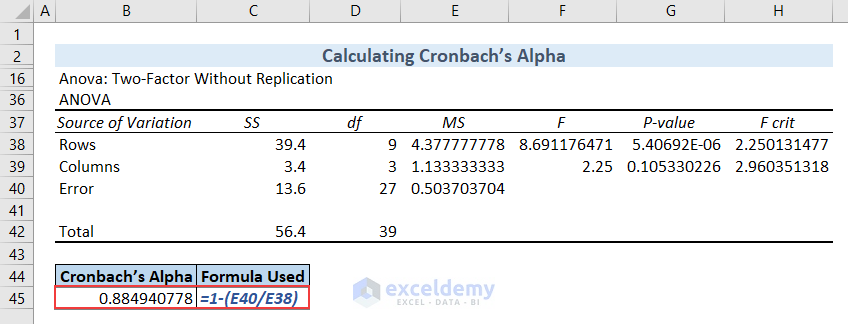
We got Cronbach’s Alpha value for our dataset. The value is approximately 0.89 which indicates a strong internal relationship within the questions of the questionnaires.
Method 2 – Compute Jensen’s Alpha Using Beta Calculation in Excel
Steps:
Portfolio Returns and Market Returns data. We need to calculate the average of these data. Use the AVERAGE function to do so.
- Type the formula in cell C17 and press ENTER to get the Average Portfolio Returns. I’ve shown the formula in cell C18 to ease your understanding.
=AVERAGE(C5:C16)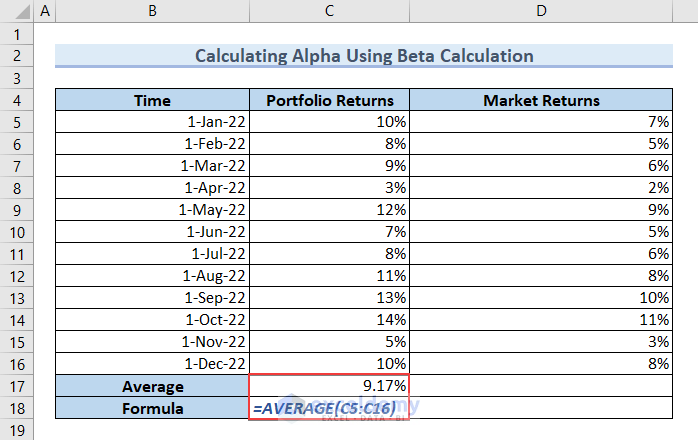
- Type the formula in cell D17 to get the Average Market Returns and press ENTER.
=AVERAGE(D5:D16)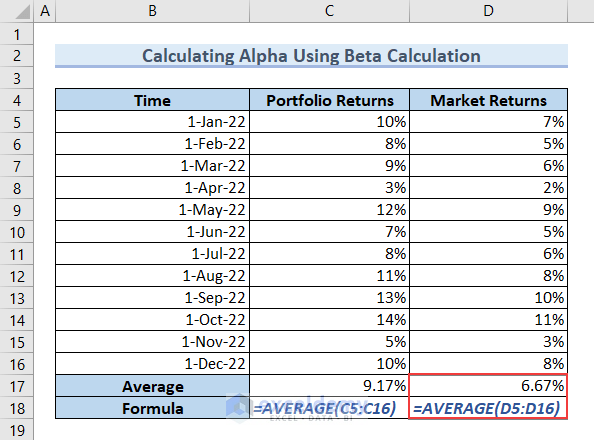
We need to calculate the Beta value. We need to get the Covariance and Variance. We’ll use the COVARIANCE function and the VAR function to do so.
- Type the following formula in cell C21 and press ENTER to get the Covariance.
=COVARIANCE.P(C5:C16,D5:D16)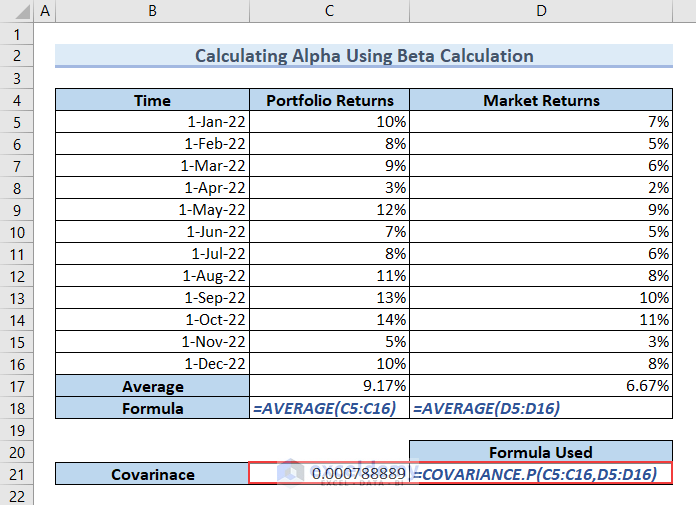
- Type the following formula in cell C22, and hit ENTER to get the Variance.
=VAR.P(C5:C16)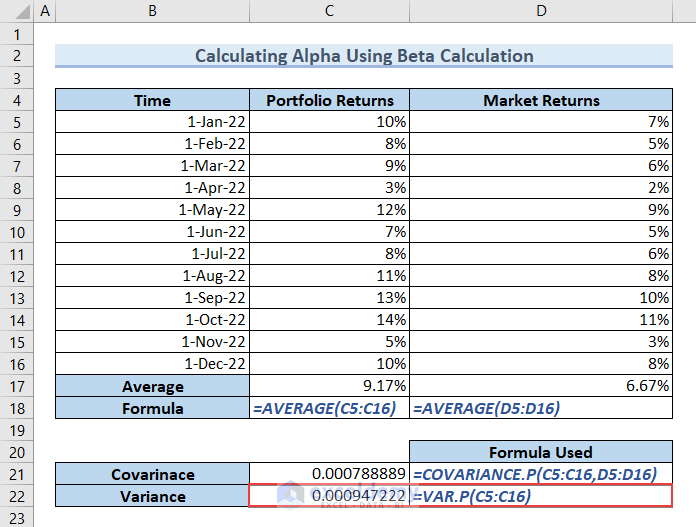
Beta is the ratio of Covariance and Variance.
- Type the formula in cell C23 and press ENTER for the Beta value.
=C21/C22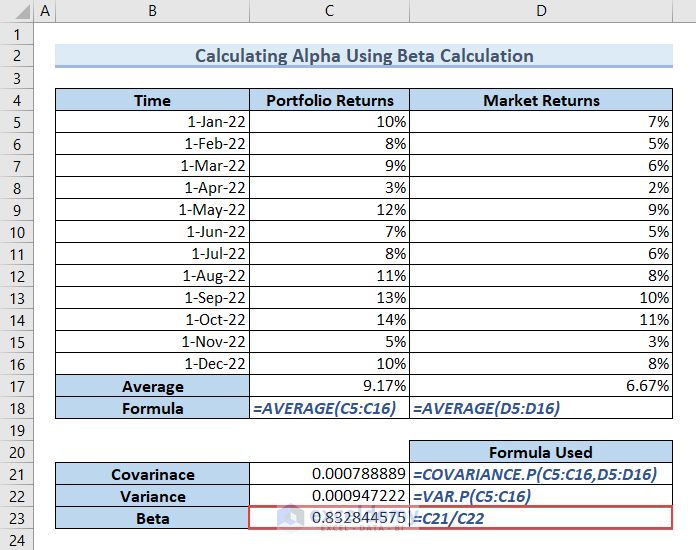
The Risk Free Rate is 1.30%. Now, we have to calculate the Expected Rate of Return. We know that the formula to calculate Expected Rate of Return is as follows.
- Type the following formula in cell C27 and hit ENTER to get the Expected Rate of Return.
=C26+C23*(D17-C26)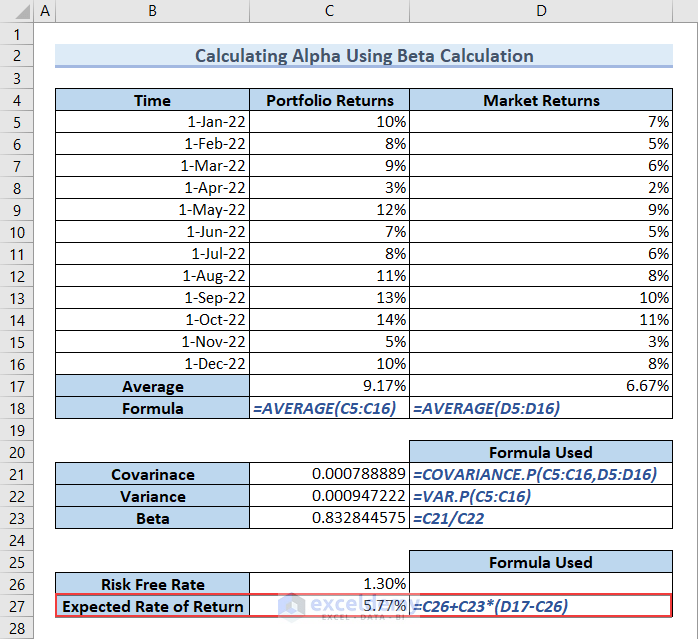
Jensen’s Alpha, also known as Alpha, is the difference between the Average Portfolio Return and the Expected Rate of Return.
- Type the formula in cell C28 and hit ENTER to get Jensen’s Alpha.
=C17-C27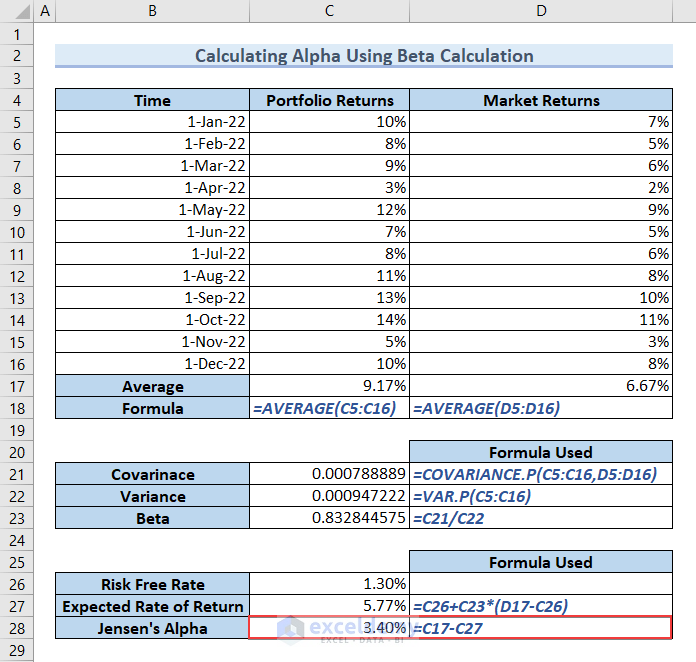
Jensen’s Alpha is 3.40%.
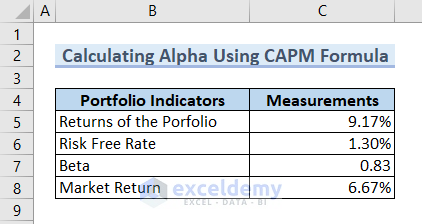
Method 3 – Calculating Alpha Using CAPM Formula
We can calculate Alpha in Excel using the CAPM formula. CAPM stands for Capital Asset Pricing Model. The formula to calculate Alpha is as follows.
where,
Our dataset includes Portfolio Indicators like Returns of the Portfolio, Risk-Free Rate, Beta, and Market Return. We can calculate Alpha using these parameters following the CAPM formula.
Now we need to calculate the Expected Rate of Return.
- Type the following formula in cell C11 and press ENTER to get the Expected Rate of Return.
=C6+C7*(C8-C6)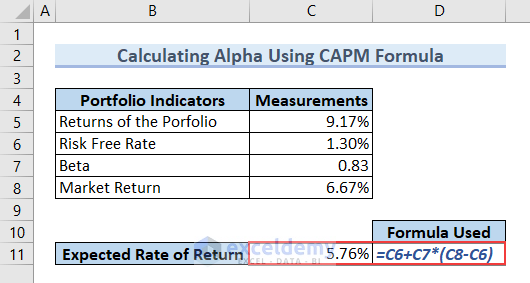
- Type the following formula in cell C12 and hit ENTER to get the value of Alpha.
=C5-C11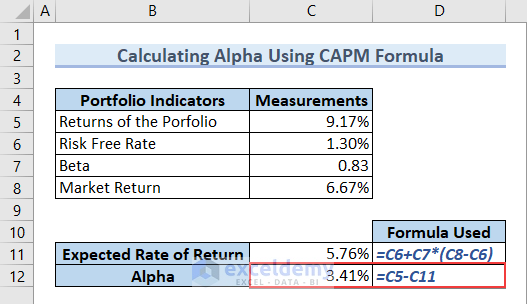
You got the Alpha value. From the figure, we can see that Alpha is 3.41%.
Method 4 – Calculating Alpha for Portfolio of Multiple Securities
Steps:
- Type the following formula in cell C16 and hit ENTER to calculate the Portfolio Returns.
=C10*E10+C11*E11+C12*E12+C13*E13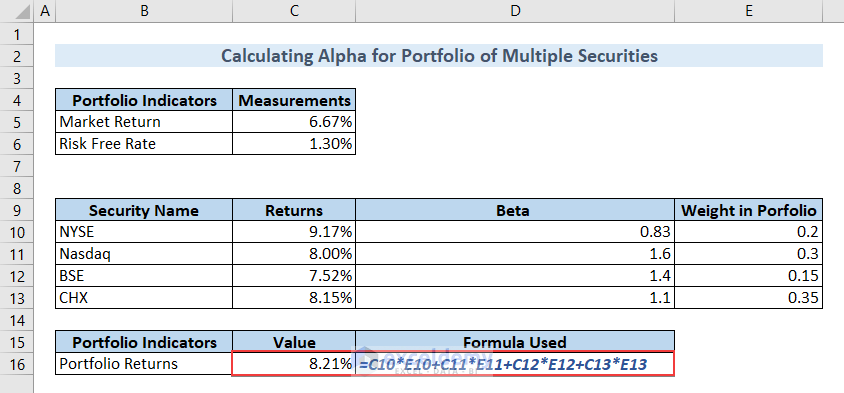
Calculate Portfolio Beta.
- Type the following formula in cell C17 and hit ENTER to calculate the Portfolio Beta.
=D10*E10+D11*E11+D12*E12+D13*E13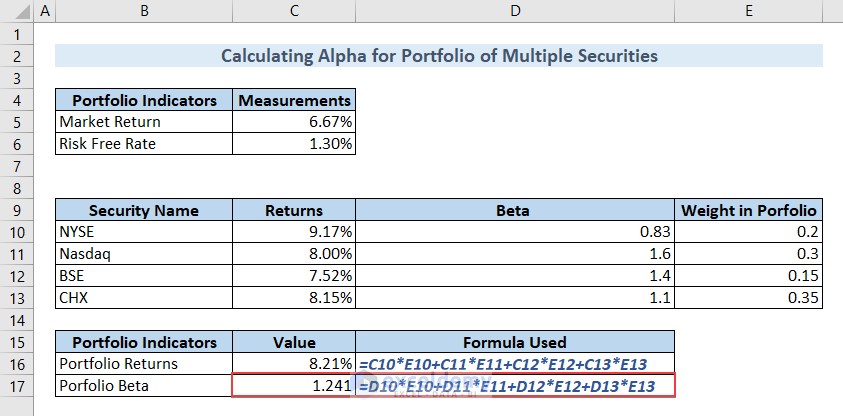
Calculate the Expected Rate of Return in the same fashion.
- Type the following formula in cell C18 and hit ENTER.
=C6+C17*(C5-C6)We’ll get the Expected Rate of Return in this way.
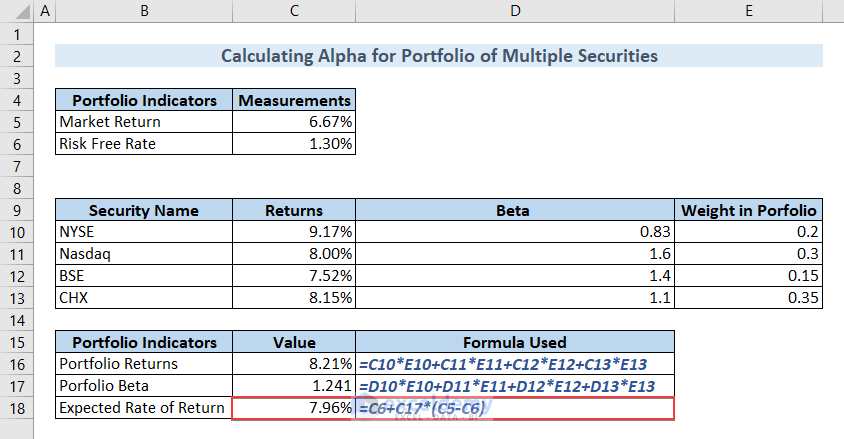
Calculate Alpha by subtracting the Expected Rate of Return from the Portfolio Returns.
- Type the following formula in cell C19 and hit ENTER to do so.
=C16-C18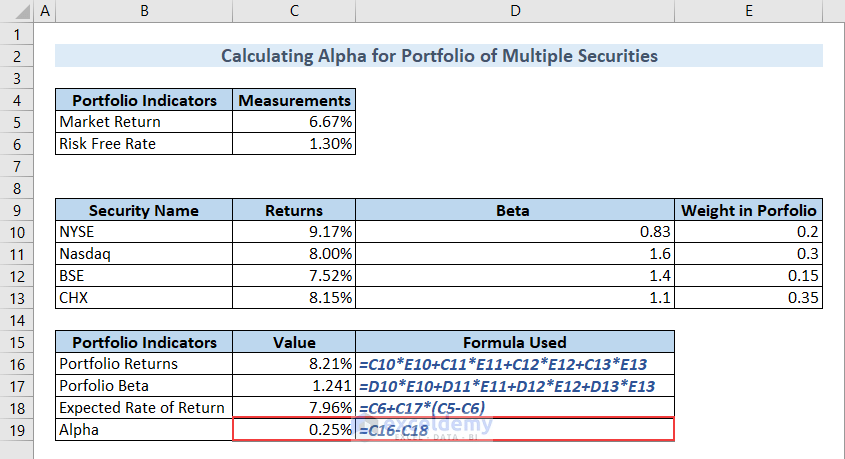
You got the Alpha value by following this method. The value is 0.25%.
Takeaways from This Article
If you’ve followed this article properly, you’ll be able to:
- Calculate Cronbach’s Alpha for any questionnaires.
- Compute Jensen’s Alpha for any portfolio.
Things to Remember
While you’re working on Alpha, you should be careful about some aspects.
- Use the COVARIANCE.P and VAR.P functions properly.
- Check the Anova settings thoroughly.
Download Practice Workbook
You can download our practice workbook from here for free!
Related Articles
- How to Add Stock Data Type in Excel
- [Solved]: Data Types Stocks and Geography Missing Problem in Excel
- How to Calculate Beta in Excel
- How to Calculate CAPM Beta in Excel
- How to Download Historical Stock Data into Excel
<< Go Back to Stocks In Excel| Excel for Finance | Learn Excel
Get FREE Advanced Excel Exercises with Solutions!

selamat malam, saya ingin bertanya terkait jensen alpha untuk kebutuhan skripsi, apa perbedaan dari portofolio return dan market return? lalu bagaimana cara menghitung market return? terimakasih, mohon bantuannya.
Hey, Ayu Indah! Thank you for your query.
Regarding your query, Market return is basically the return that is generated by a broad market index. It deals with the whole market for a particular time period and calculates the value of the market as a whole.
On the other hand, the Portfolio return basically indicates the return generated by a specific investment portfolio or fund.
To differentiate between these two returns, market return is the benchmark that is followed when calculating portfolio return. When calculating market return, no risk factor is taken into consideration. But, when calculating portfolio return, the risk factors are calculated and the market return is taken as a benchmark to determine the gains and losses of the investment portfolio.
After calculating both these returns, Alpha can be calculated. And, with positive alpha, it can be decided that there was outperformance to gain profits. And, negative alpha suggests that, with risk factors, the investment portfolio can result in losses.
To calculate market return, the whole market is taken into consideration and a particular time is considered. So, to get this, the beginning value of the market during the timeline is recorded and the ending value of the market during the timeline is also recorded. Following, the total dividends or net income is calculated during the timeline.
Then the market return is calculated as follows:
Total Market Return = [(Ending Value – Beginning Value) + Dividends]/ Beginning Value
To get the value in percentage, multiply the previous result by 100.
So, Market Return (in Percentage) = Total Market Return * 100
Hope, you will now be able to differentiate between market return and portfolio return and you will be able to calculate market return. If you have any further queries, please feel free to ask. Thank you!
With Regards,
Md. Tanjim Reza Tanim