Download the Practice Workbook
How to Download Historical Stock Data into Excel: 7 Steps
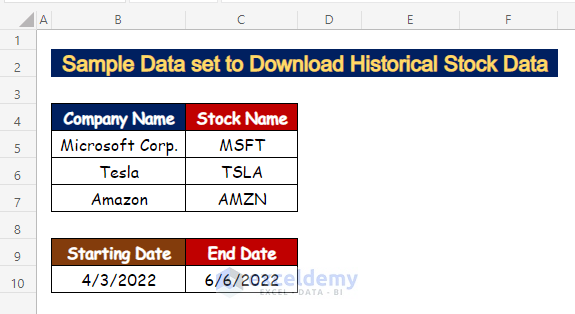
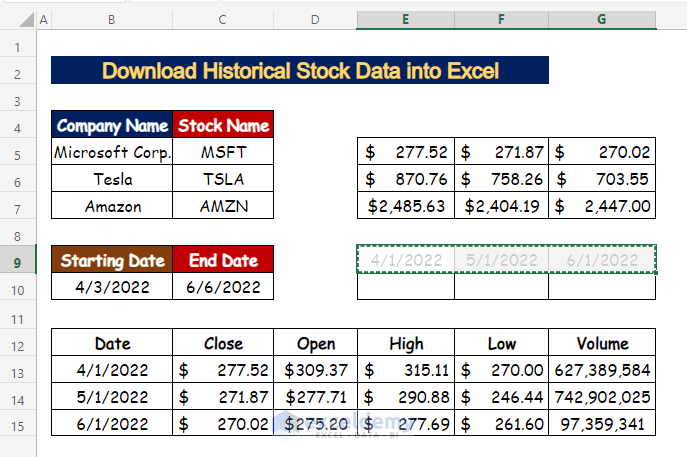
We’ve included a sample data set in the image below, which includes the company names as well as their stock names. We’ve got a start date of about three months ago and an end date of today. Between the intervals, we will download the historical stock data of the three companies on a monthly basis. We’ll make sparklines with the closing values of the stock prices of the three companies. To do so, we’ll use Excel’s STOCKHISTORY function.
Notes: The STOCK HISTORY function is only available with a Microsoft 365 subscription.
Step 1 – Insert the Stock Argument for the STOCKHISTORY Function
- Select cell C5 to insert the stock name (MSFT) of the Microsoft Corporation.
=STOCKHISTORY(C5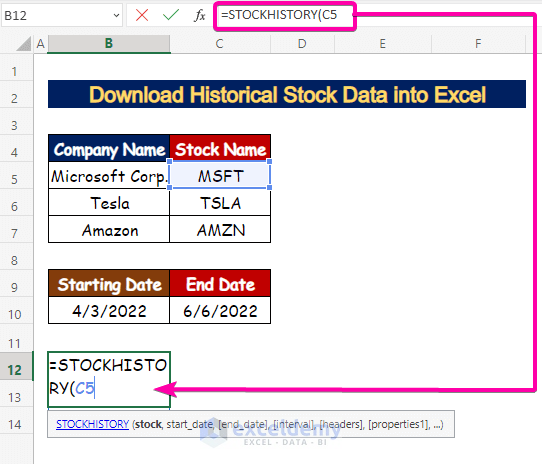
Step 2 – Insert the Start Date and End Date
- For the start_date argument, select cell B10.
=STOCKHISTORY(C5,B10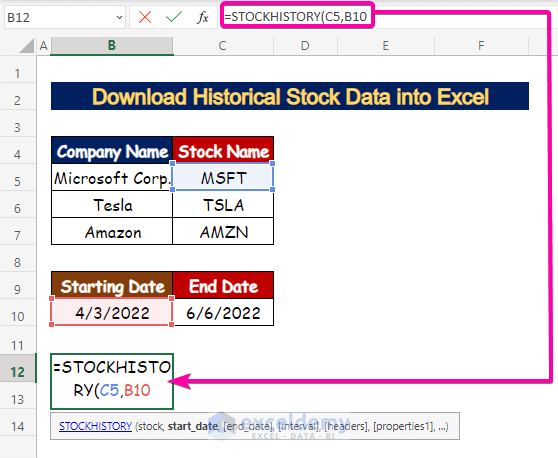
- For the end_date argument, select cell C10.
=STOCKHISTORY(C5,B10,C10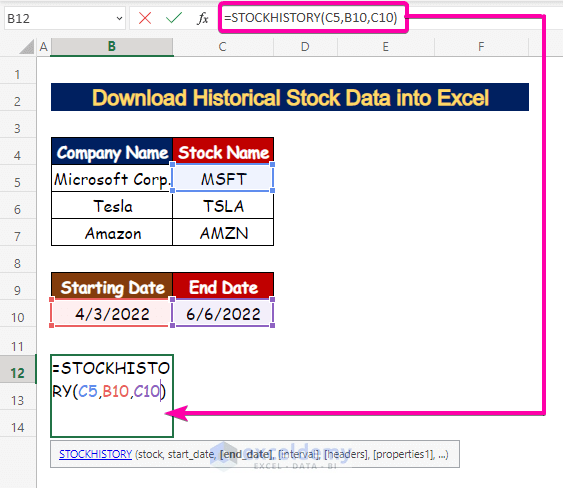
Step 3 – Select the Interval to Show Historical Data
- The interval argument returns how you want to get the historical data.
- 0 = daily interval.
- 1 = weekly interval.
- 2 = monthly interval.
- By default, it is set to zero (0).
- In our example, we will type 2 as we want to get the result for monthly values.
=STOCKHISTORY(C5,B10,C10,2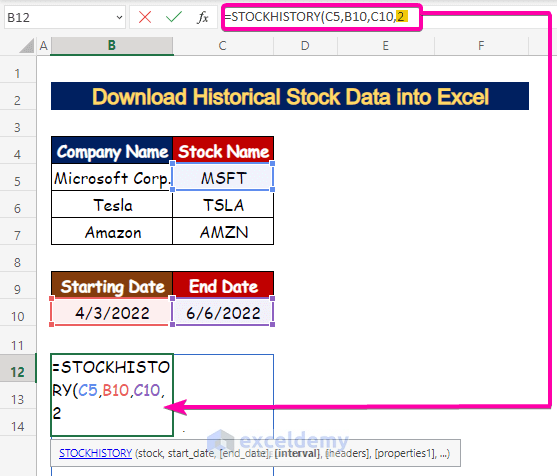
Step 4 – Apply Headers to Classify the Columns
- To show headers in the result data table, define the header argument.
- 0 = no headers.
- 1 = show headers.
- 2 = Show instrument identifier and headers.
- We will select 1 to show headers.
=STOCKHISTORY(C5,B10,C10,2,1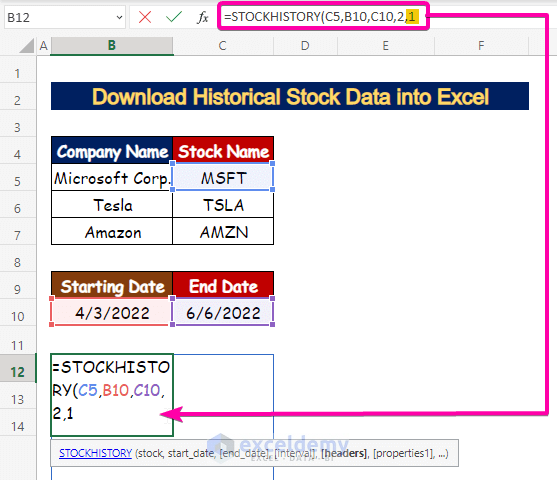
Step 5 – Enter the Properties to Show in the Table
- The Properties arguments defines what you want to see in the column headers. Generally, there are 6 properties [properties1-properties6] you can apply:
- [properties1] = Date.
- [properties2] = Close (the closing stock price at the end of the day).
- [properties3] = Open (the opening stock price at the start of the day).
- [properties4] = High (the highest stock rate on that day).
- [properties5] = Low (lowest stock rate on that day).
- [properties6] = Volume (numbers of shareholders).
- We will enter the properties argument with the following formula:
=STOCKHISTORY(C5,B10,C10,2,1,0,1,2,3,4,5)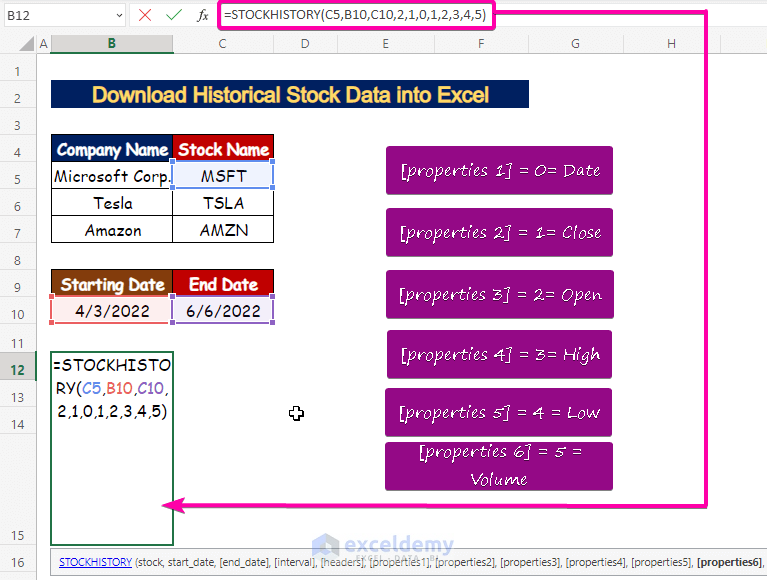
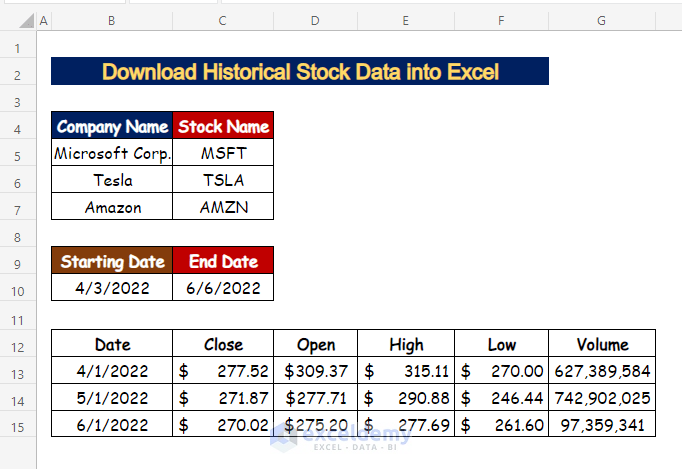
- You will receive the historical stock data for Microsoft Corporation.
Step 6 – Get Historical Stock Data for Multiple Companies
- In cell B12, insert the following formula with the start_date ($B$10) and end_date ($C$10) as absolute references.
=STOCKHISTORY(C5,$B$10,$C$10,2,1,0,1,2,3,4,5)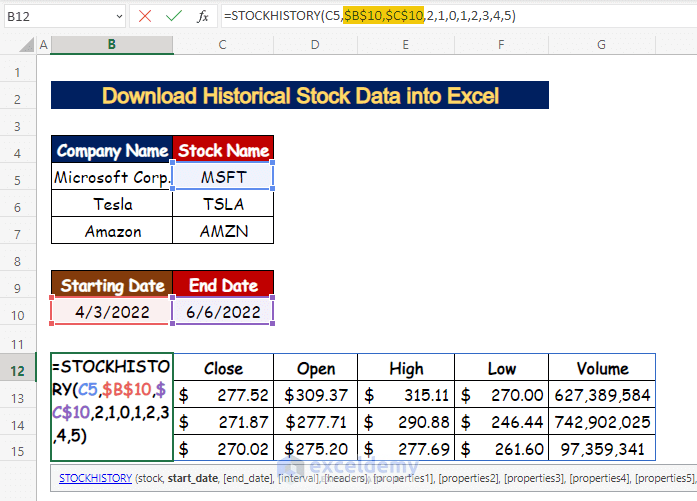
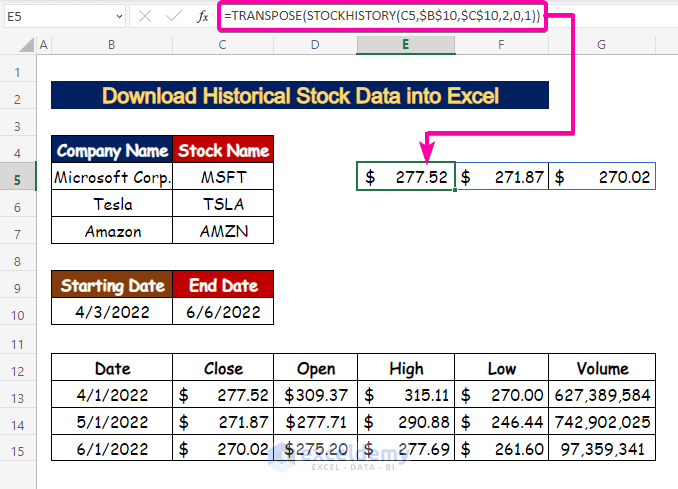
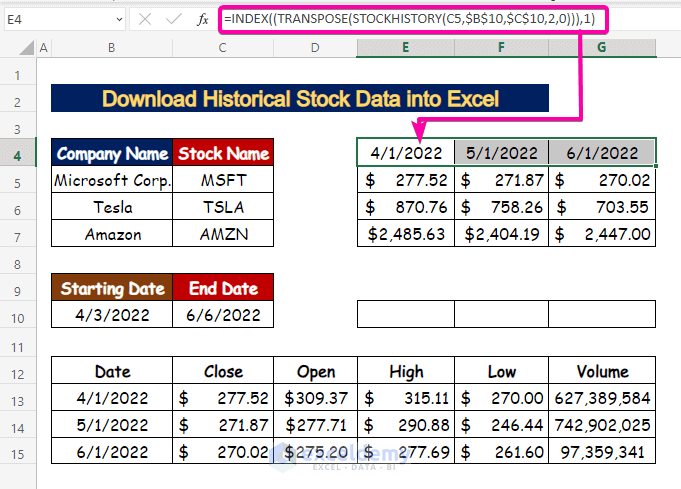
- In cell E5, transpose the value of the closing price (C13:C15) with the following formula of the TRANSPOSE function.
=TRANSPOSE(STOCKHISTORY(C5,$B$10,$C$10,2,0,1))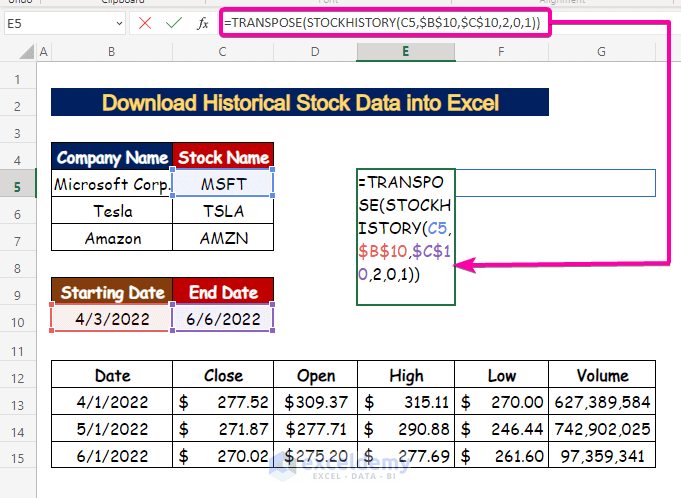
- You will get a transposed value of the range C13:C15.
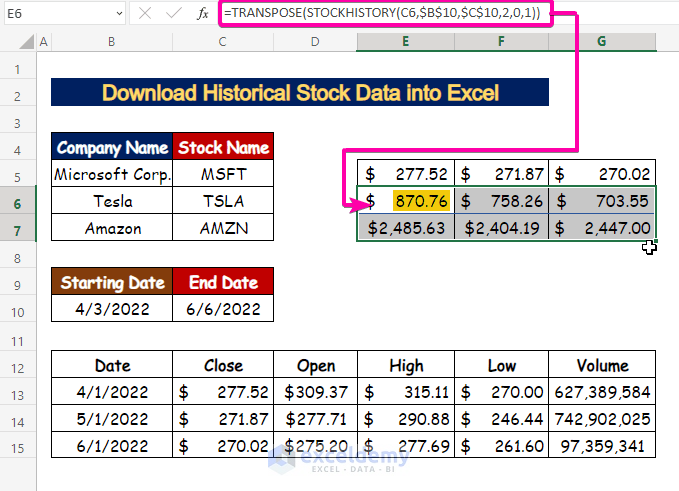
- Use the AutoFill Tool to autofill the stock closing values of the two other companies (Tesla and Amazon).
- Cell E6 represents the stock closing value of Tesla on the date of 4/1/2022.
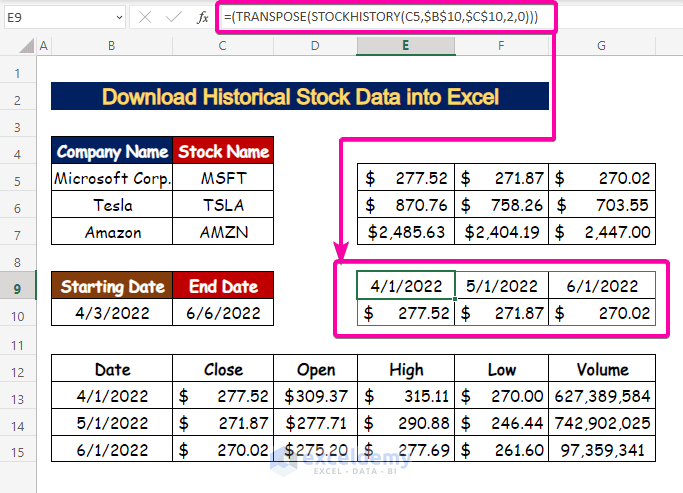
- In cell E9, use the following formula with the TRANSPOSE function.
=(TRANSPOSE(STOCKHISTORY(C5,$B$10,$C$10,2,0)))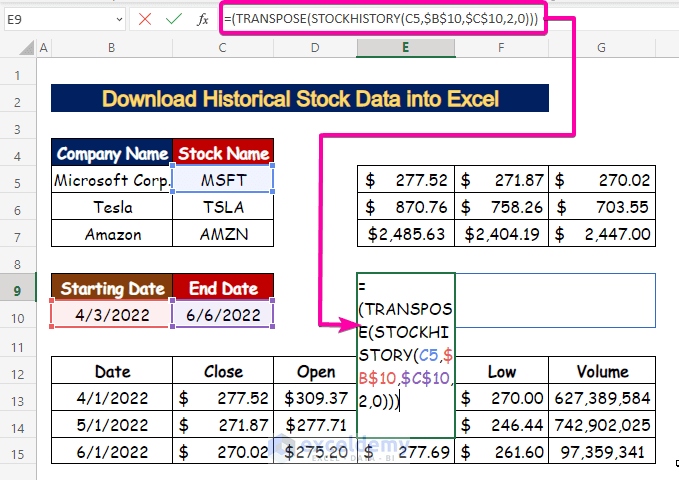
You will get the closing stock prices along with their dates.
- To get only the dates, apply the previous formula nested with the INDEX function. Type 1 for the row_num (row number) argument.
=INDEX((TRANSPOSE(STOCKHISTORY(C5,$B$10,$C$10,2,0))),1)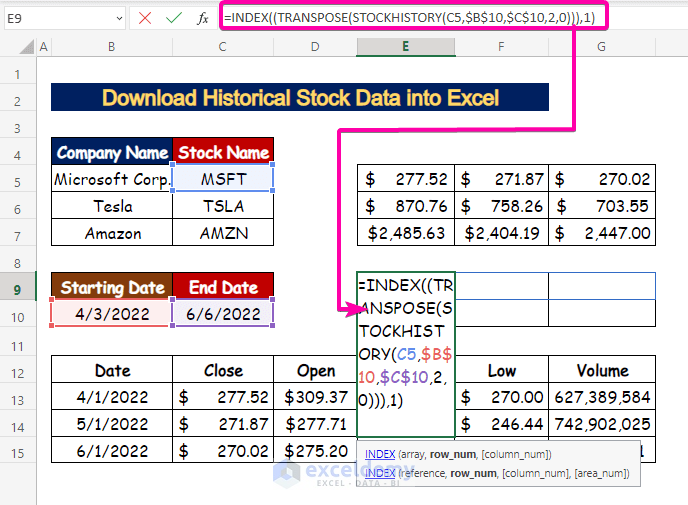
- Only the dates will appear in the row, as it was the first row.
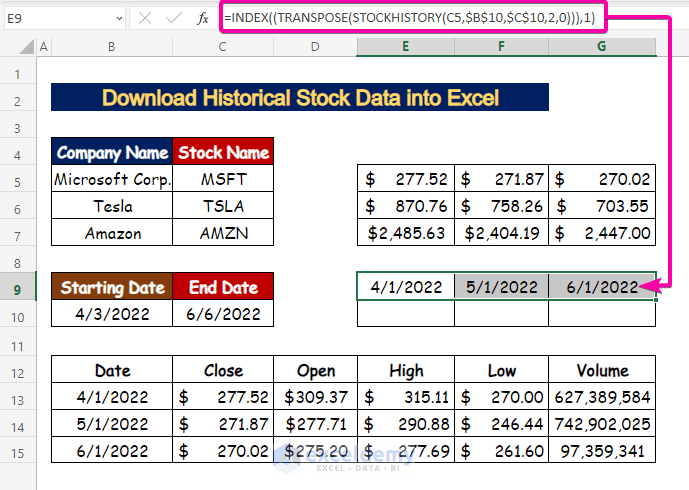
- Press Ctrl + X to cut the date values.
- Press Ctrl + V to paste in cell E4.
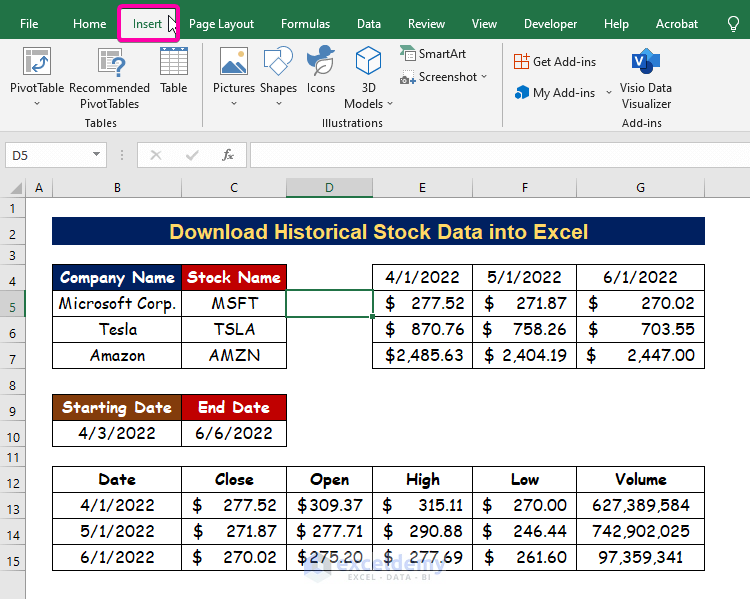
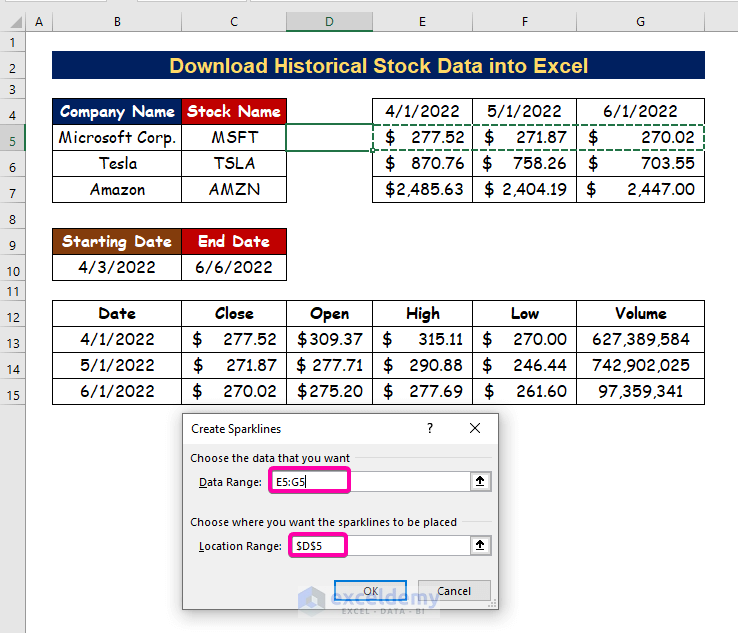
Step 7 – Create Sparklines for Historical Stock Data
- Select a cell.
- Click on the Insert tab.
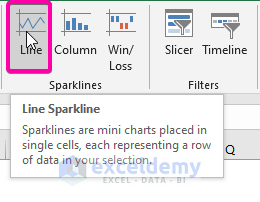
- From the Sparklines group, select the Line option.
- In the Data Range box, select the range E5:G5 for the Microsoft Corporation.
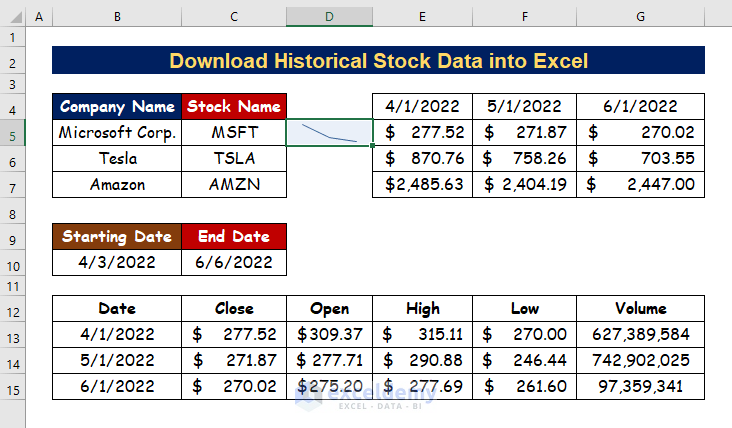
- Click OK.
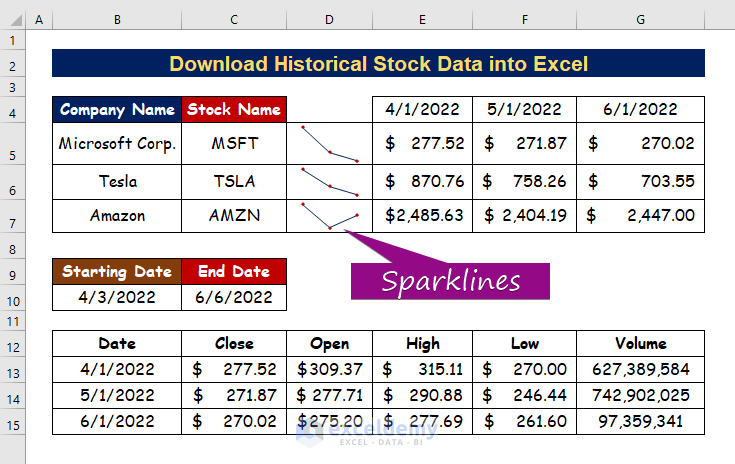
- This creates the first sparkline for Microsoft Corporation. It displays the stock price’s ups and downs at the intervals you specify.
- Drag the AutoFill Tool down to get the rest of the company’s sparklines.
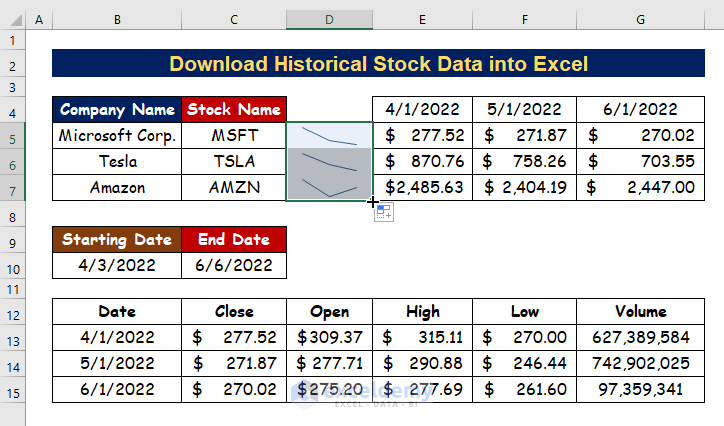
- Edit with a marker or color as you want to show the sparklines to be represented.
Related Articles
- How to Add Stock Data Type in Excel
- [Solved]: Data Types Stocks and Geography Missing Problem in Excel
- How to Calculate Beta in Excel
- How to Calculate CAPM Beta in Excel
- How to Calculate Alpha in Excel
- How to Calculate Alpha and Beta in Excel
<< Go Back to Stocks In Excel| Excel for Finance | Learn Excel
Get FREE Advanced Excel Exercises with Solutions!

This is a great tutorial for downloading historical stock data into Excel. It is easy to follow and provides clear instructions. I would recommend this tutorial to anyone looking to import historical stock data into Excel.
Greetings INSTASAVETUBE,
Countless thanks for your kind words of praise. The Exceldemy team has always been there to assist and has been working to make knowledge accessible to everyone globally. And without a doubt, you are the kind of great people that empower us.
Best Regards,
Bhubon Costa
(Exceldemy Team)