Do you want to know how your stock portfolio is doing in relation to the market? Do you want to know if the profits on your investments correspond with the risk you are taking? Alpha is a crucial indicator that can aid in providing the answers to these queries. According to the amount of risk in a stock, portfolio, or asset, alpha quantifies the excess return over the expected return. So, you may want to calculate alpha in Excel. In this article, we are going to go through the steps to calculate alpha of stock in Excel. So, let’s get started.
What Is the Alpha (α) of a Stock?
Alpha is an estimation of the performance of a particular stock compared to the benchmark index. Investors use alpha to assess a stock’s potential to provide returns above and beyond those predicted by its level of risk. The level of risk is first identified with the calculation of beta, and then the output of alpha indicates whether the stock has performed or underperformed.
A positive alpha indicates that a stock has outperformed its benchmark index, while a negative alpha indicates that it has underperformed. For example, if a stock has an alpha of 2, it has outperformed its benchmark index by 2%. If it has an alpha of -0.1, it has underperformed its benchmark index by 0.1%.
Basically, alpha provides a way to evaluate a stock’s performance beyond just looking at its returns. So, alpha holds strong significance in the study of stock market investment.
Formula to Calculate Alpha (α) of a Stock:
The arithmetic formula for calculating the alpha of a stock is stated below.
Alpha (α)=R-Rf-β(Rm-Rf)
Where R is the average return of the portfolio or stock. Rf is the risk-free factor, β is the sensitivity of the stock to the market, and Rm is the average market return.
The Importance of Calculating Alpha (α) of a Stock:
Alpha has a lot of significance in the stock market. The importance is:
- It aids investors in assessing a stock’s or portfolio manager’s performance. A positive alpha indicates that the management has added value and that the company or portfolio has outperformed the market. On the other side, if the alpha is negative, it means that the management has not generated value and the company or portfolio has underperformed in the market.
- It can support the creation of the ideal portfolio. Investors may assess which assets are expected to offer the highest returns for a particular degree of risk by calculating the alpha of various stocks and portfolios, and they can then modify their portfolios appropriately.
- It can assist investors in identifying stocks or portfolios with the potential for high returns.
Overall, calculating alpha is an important tool for investors in the stock market, as it helps to evaluate performance, identify potential high-performing securities, and construct an optimal portfolio.
How to Calculate the Alpha of a Stock in Excel (Step-by-Step)
In the stock market, the price of a stock fluctuates with the price of the overall market. As the alpha predicts the performance of a stock compared to the benchmark index. So, you need to know the historical price of the stock over a time period and also need the price of a benchmark index at the same time period.
Here, we have taken a dataset of the “Monthly Closing of AAPL Stocks and the S&P 500 Index”. We will calculate the alpha of a stock in Excel from the dataset.
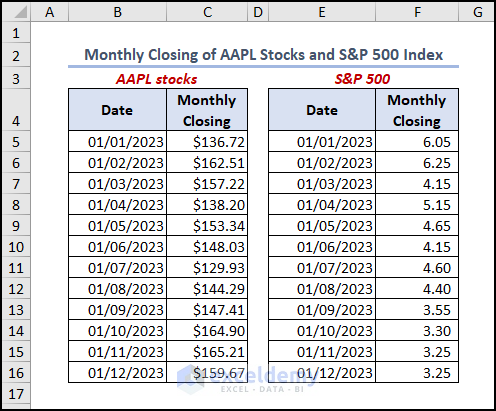
Not to mention, we have used the Microsoft 365 version. You may use any other version at your convenience.
Step 1: Calculate Returns and Average Returns of a Stock Market
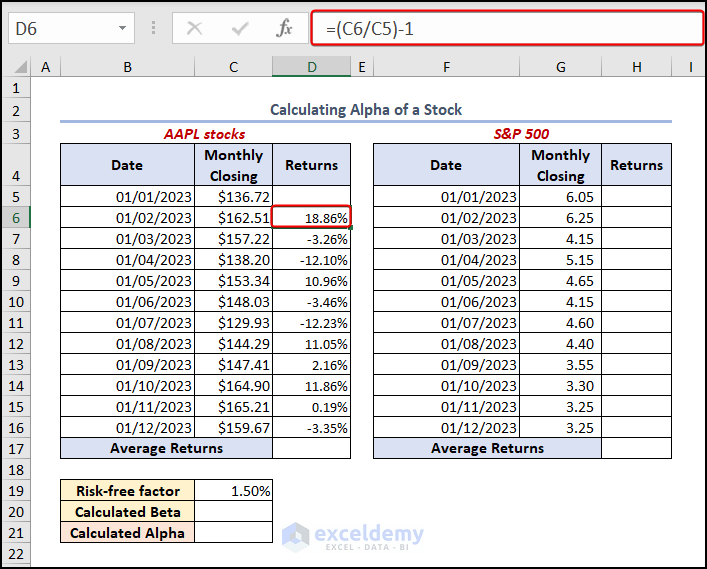
You need to calculate the returns first. Returns are a percentage of the share’s value compared to its initial value. We also need to insert the risk-free factor of our stock.
- Initially, in cell D6, write up the following formula.
=(C6/C5)-1
Where C5 is the initial price of the stock and C6 is the final price of the stock.
- Press ENTER, and drag down the Fill Handle tool for the other cells. You need to convert the value to a percentage using the Format Cells option.
So, these will be the returns on the stock of AAPL.
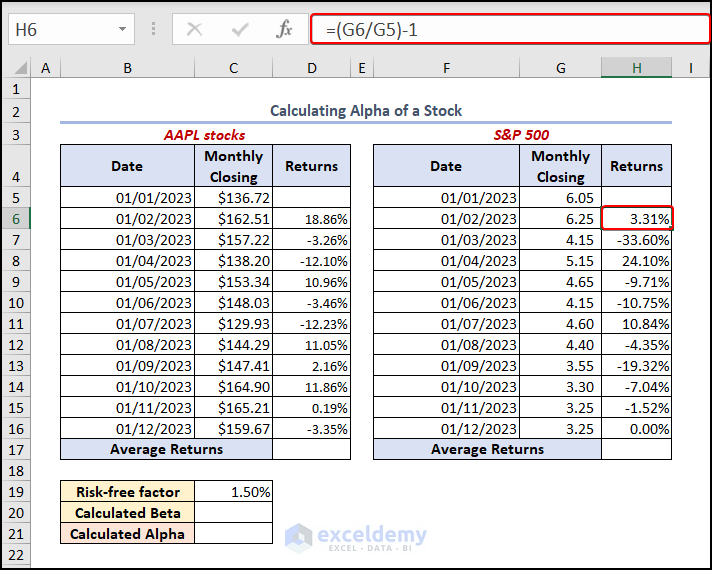
- At this moment, we will calculate the returns of the benchmark index, which is the S&P 500 index.
- Move to cell H6, and type the formula.
=(G6/G5)-1
Where G5 is the initial value of the overall market stocks and G6 is the present value of the overall market stocks.
- Press ENTER, and drag it down for the other cells. You also need to set the value in percentage form.
After doing that, we calculate the average of the returns that we have calculated so far. We have used the AVERAGE function here. You can estimate the average manually, which is a time-consuming process. For calculating the average,
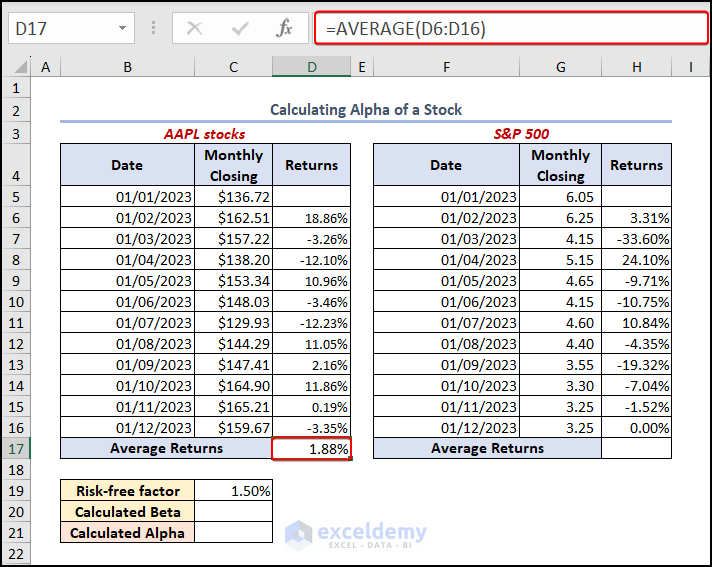
- Move to cell D17 and type there. This formula will calculate the mean of your returns.
=AVERAGE(D6:D16)
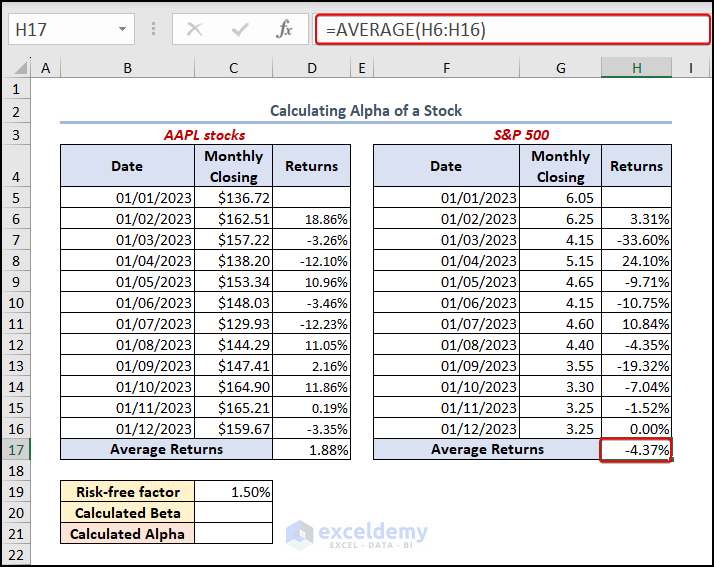
- Now, go to cell H17 for the mean of the benchmark index’s returns. Write the following formula there.
=AVERAGE(H6:H16)
This will also calculate the average of H6:H16 cells, which is the returns of the S&P 500.
Read More: How to Calculate Alpha and Beta in Excel
Step 2: Estimate Beta of the Stock
We need to calculate the beta of our stock before calculating the alpha. In the alpha formula, we need to insert the beta. We have used the COVARIANCE.P and VAR.P functions to calculate the beta.
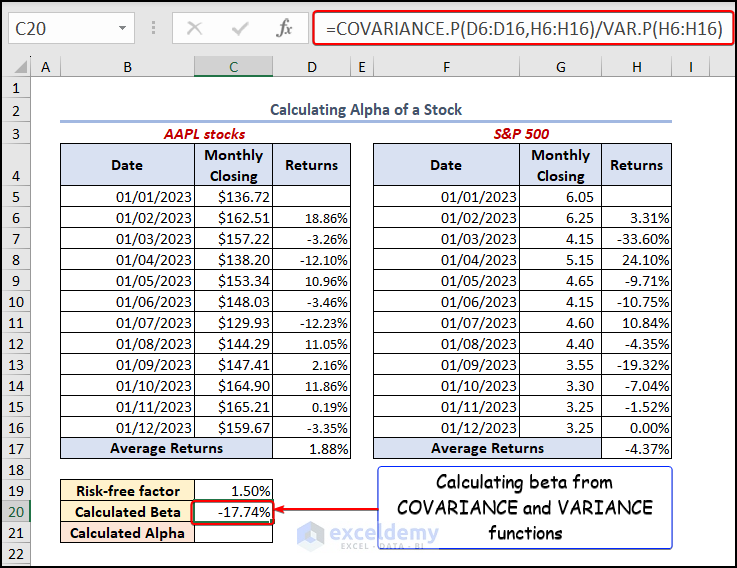
- In cell C20, insert the following formula.
=COVARIANCE.P(D6:D16,H6:H16)/VAR.P(H6:H16)
Here, COVARIANCE.P(D6:D16, H6:H16) estimates the covariance between D6:D16 and H6:H16. Then we divided the value by VAR.P(H6:H16) where VAR.P calculates the variance of H6:H16 cells, which is the market’s return value.
- Press ENTER, and you will get the beta of your stock.
Step 3: Evaluate Alpha of the Stock
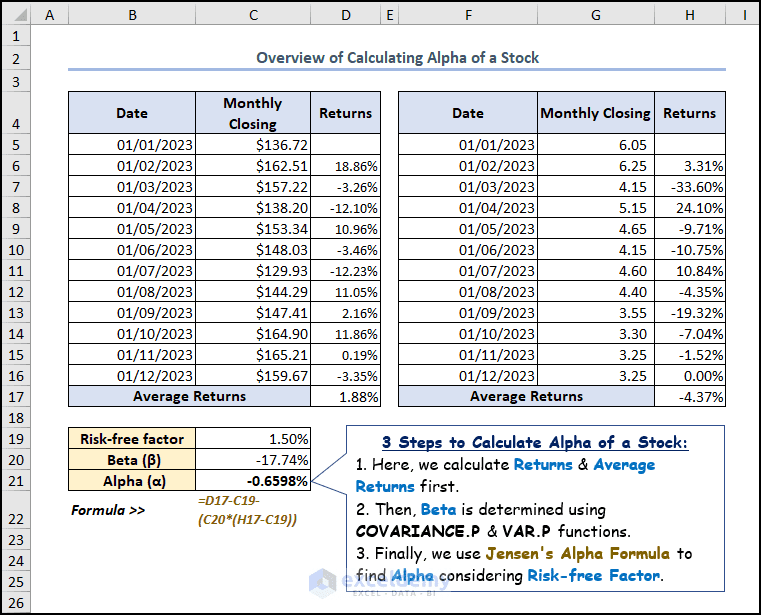
Lastly, you will be able to calculate the alpha after calculating all the factors we have stated above. You need to move to cell G19 and insert the below formula for calculating alpha.
=D17-C19-(C20*(H17-C19))
Here, D17 is the average returns of AAPL stock, C19 is the risk-free factor, C20 is the calculated beta, and H17 is the average returns of S&P 500 stock.
- You will get your desired output after pressing ENTER. See the below image for a better visualization.
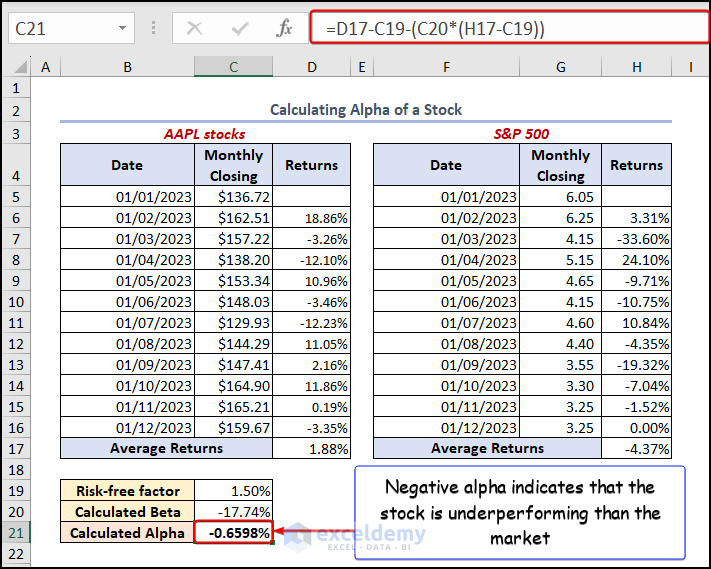
Here, the negative alpha indicates that the AAPL stock is underperforming compared to the benchmark index, the S&P 500.
Frequently Asked Questions
- How do I get historical returns for stock in Excel?
Historical returns for a stock can be obtained from a financial data provider or by using the STOCKHISTORY function in Excel. The formula to retrieve the historical returns for a stock is:
=STOCKHISTORY("Stock Name",start_date,end_date, "Daily/Weekly/Monthly")
- What is the risk-free rate of return?
The risk-free rate of return is the rate of return on an investment that is considered to be risk-free, such as a U.S. Treasury bond. It is used as a benchmark to measure the excess return that a stock or portfolio generates over and above this risk-free rate.
- What is the market return?
The market return is the return on a broad-based market index, such as the S&P 500 or the Dow Jones Industrial Average. It is used as a benchmark to measure the excess return that a stock or portfolio generates over and above the market return.
- What data is required to calculate alpha in Excel?
To calculate alpha in Excel, you need to have access to the following data:
- Historical returns for the stock or portfolio
- The beta of the stock or portfolio
- The market return
- The risk-free rate of return
Things to Remember
- It’s important to use the same time period for the stock and the benchmark stock to evaluate alpha. Make sure that.
- You need to calculate beta correctly before you can calculate alpha. Make sure that you are using the correct formula to calculate beta.
- You should need to calculate the returns, average returns, and beta of the stock and insert the risk-free factor accurately to get the proper alpha.
Download Practice Workbook
Download the following practice workbook. It will help you understand the topic more clearly.
Conclusion
So, this is the end of our article. We strongly believe that you understand the steps to calculate the alpha of a stock in Excel. Alpha provides a more complete picture of a stock’s ability to generate returns. This can help investors make more informed decisions about which stocks to buy and sell. However, it’s important to note that alpha is just one of many factors to consider when evaluating a stock. It should be used in conjunction with other measures and factors, such as earnings growth, valuation, and industry trends, to gain a more complete understanding of the investment opportunity. That’s all for today. If you have any queries, feel free to knock us through emails or comments.

