Overview of Alpha and Beta in the Stock Market
Alpha and Beta are two important measures used in finance to evaluate the performance of an investment compared to its standard.
Alpha is a measure of an investment’s performance that cannot be attributed to the performance of the market as a whole. A positive alpha indicates that the investment has performed better than its standard, while a negative alpha indicates that the investment has underperformed.
Beta measures how much an investment’s returns move in response to changes in the standard returns. A beta of 1 indicates that an investment’s returns move in line with the standard returns, while a beta greater than 1 indicates that the investment is more volatile than the standard, and a beta less than 1 indicates that the investment is less volatile than the standard.
Formula for Calculating Alpha:
Formula for Calculating Beta:
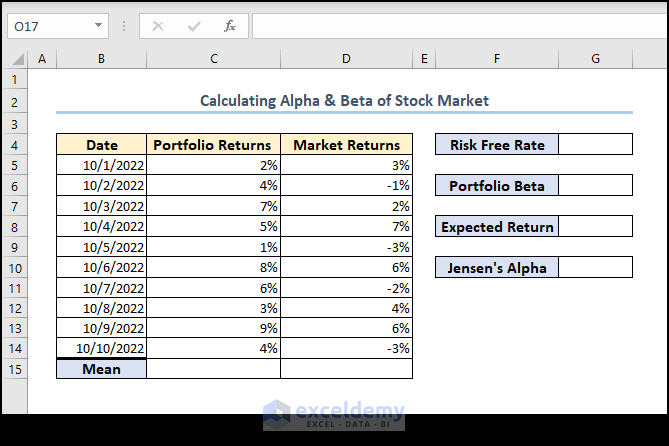
Step 1 – Prepare Outline and Dataset
- Create a dataset containing Portfolio Returns (standard returns) and Market Returns.
- Use the AVERAGE function in Excel to find the average of Portfolio Returns:
=AVERAGE(C5:C14)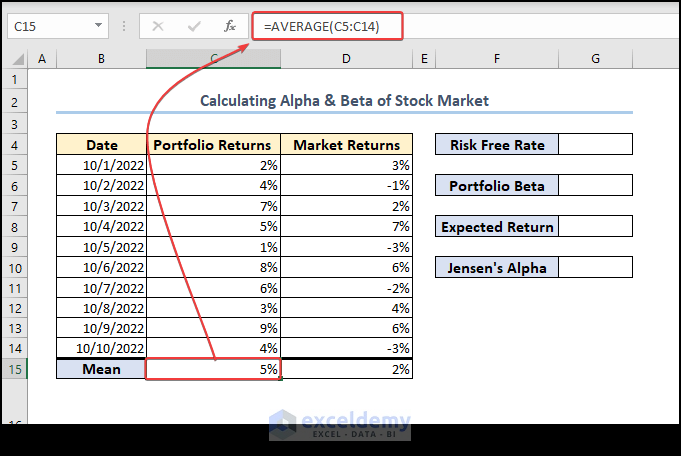
- Similarly, calculate the average of Market Returns:
=AVERAGE(D5:D14)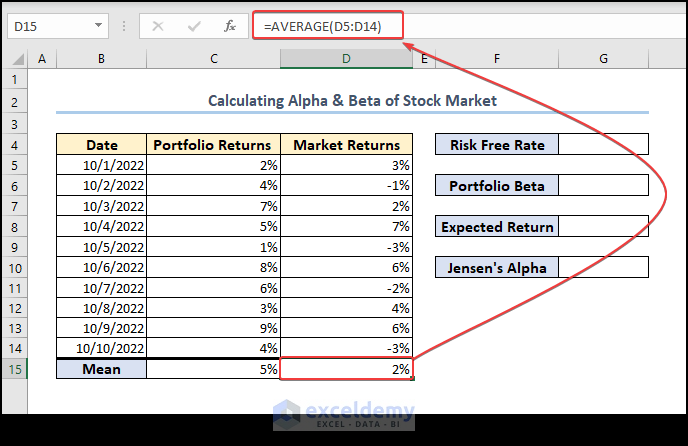
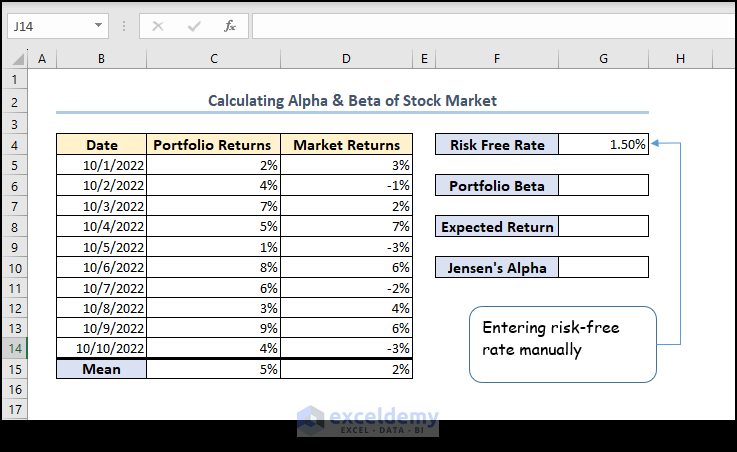
Step 2 – Define a Risk-Free Rate
- Manually insert the Risk-Free Rate. Let’s assume a risk-free rate of 1.5%.
Step 3 – Calculate Beta Using COVARIANCE.P and VAR.P Functions
- Calculate Beta using the following formula in cell G6:
=COVARIANCE.P(C5:C14,D5:D14)/VAR.P(C5:C14)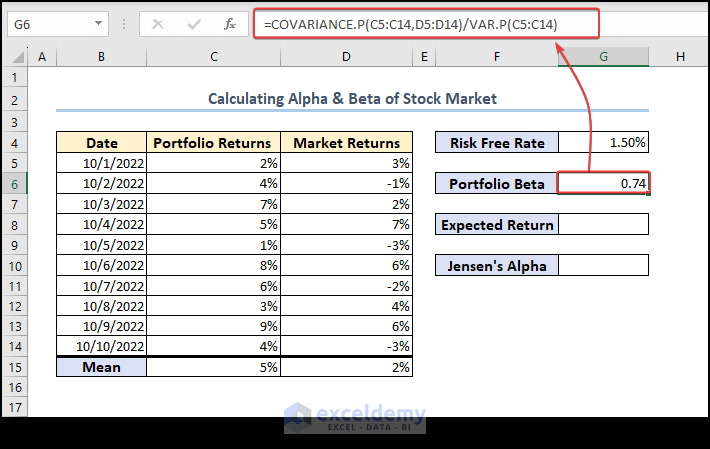
Explanation: The COVARIANCE.P function computes the covariance between the two data sets (Portfolio Returns (C5:C14) and Market Returns (C5:C14 )), and VAR.P calculates the variance of Portfolio Returns. We divided the covariance result with the variance result to get Beta.
Step 4 – Determine Expected Return
- Calculate the Expected Return using the following formula in cell G8:
=G4+G6*(D15-G4)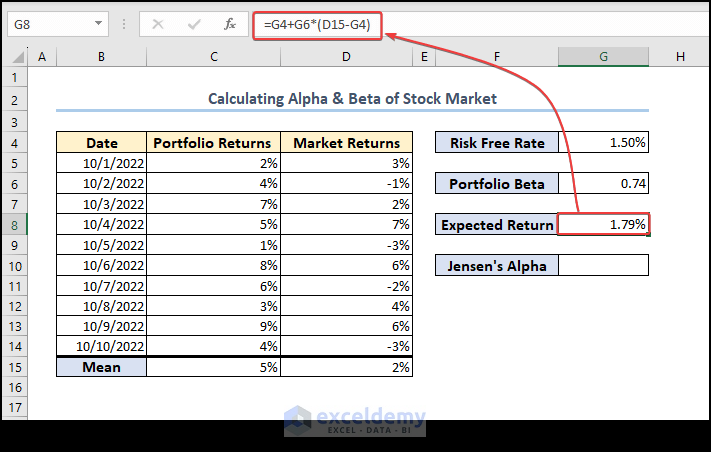
Explanation: Expected Return = (Risk-free rate + Beta * (Average market returns of the benchmark – Risk-free rate))
Step 5 – Calculate Jensen’s Alpha
- Compute Alpha using the following formula in cell G10:
=C15-G8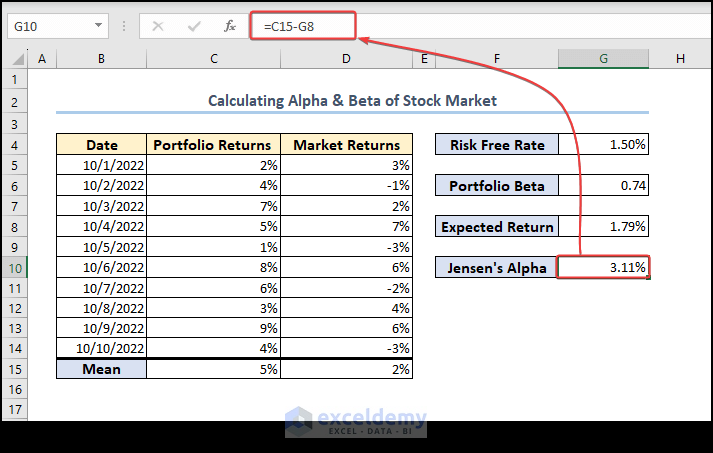
Explanation: Alpha = Average portfolio return of the investment – Expected Return
Frequently Asked Questions
- Interpreting Alpha and Beta:
- A positive alpha means the investment outperformed its standard, while a negative alpha indicates underperformance.
- Beta of 1 implies returns move in line with the standard, >1 means higher volatility, and <1 means lower volatility.
- Calculating Daily Returns:
- Use the formula:
(Price today - Price yesterday) / Price yesterday.
- Use the formula:
- Limitations of Alpha and Beta:
- Historical data-based; may not predict future performance.
- Ignores management quality, industry trends, and macroeconomic conditions.
- Not suitable for all investment types.
Remember
- To handle cell references carefully (consider absolute references with “$” sign).
- Adjust the Risk-Free Rate as needed.
Download Practice Workbook
You can download the practice workbook from here:
Related Articles
- How to Add Stock Data Type in Excel
- [Solved]: Data Types Stocks and Geography Missing Problem in Excel
- How to Calculate CAPM Beta in Excel
- How to Download Historical Stock Data into Excel
<< Go Back to Stocks In Excel| Excel for Finance | Learn Excel
Get FREE Advanced Excel Exercises with Solutions!
