STEP 1 – Create a Query
Create a query to import historical stock prices from Yahoo! Finance of a specific company. Here, Microsoft’s historical stock prices for the last 3 months.
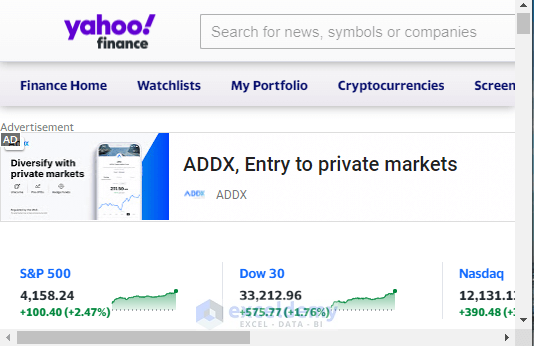
- Go to Yahoo! Finance.
- Search for Microsoft in the search bar.
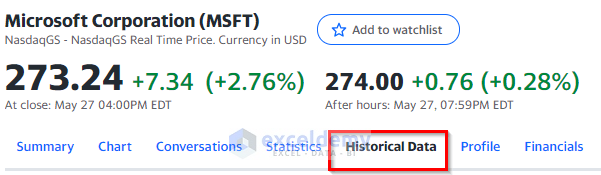
- Go to ‘Historical Data’.
- Set the Time Period: 3M.
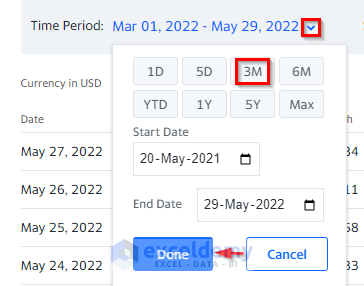
- Right-click the Download option.
- Select ‘Copy link address’.

- Open a new Excel sheet.
- Go to Data.
- Click ‘From Web’.
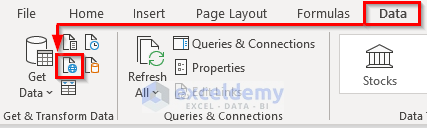
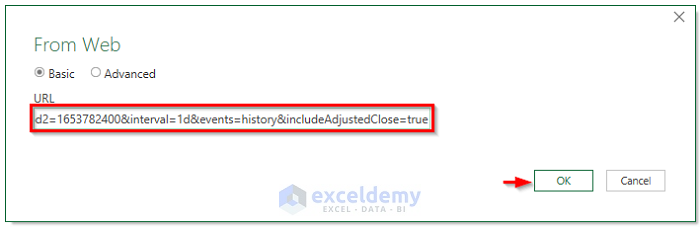
- A new dialog box will open.
- Paste the link in the URL field.
- Click OK.
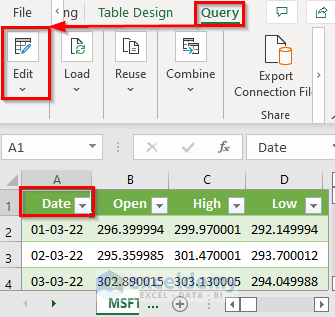
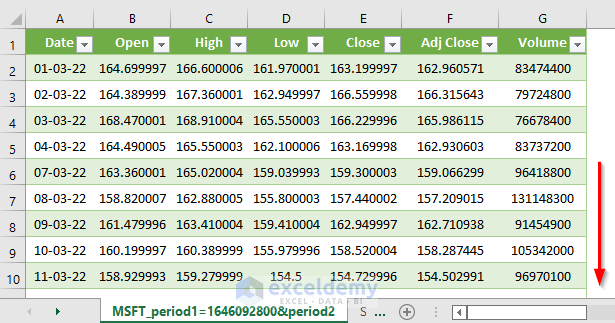
A data preview is displayed.
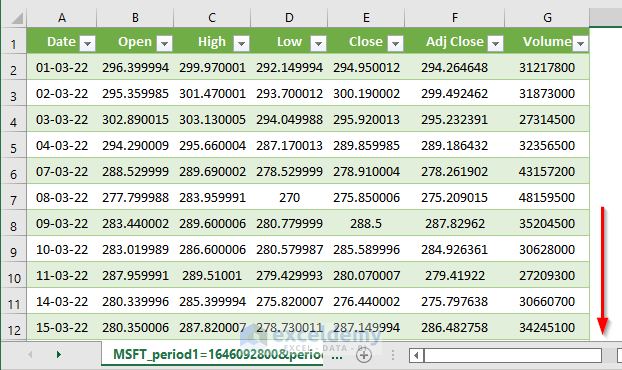
NOTE: The above image shows only a part of the full dataset.
STEP 2 – Fix the Variables
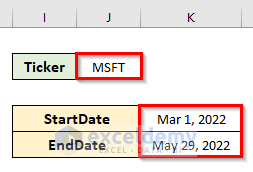
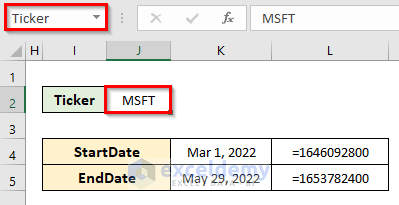
To import data for ticker symbol, start date, and end date. Create 3 named ranges (Ticker, StartDate, and EndDate).
- Go to the worksheet containing the data query.
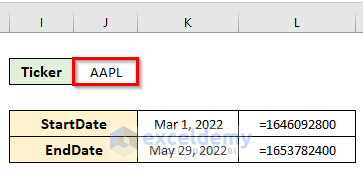
- Create fields for Ticker, StartDate, and EndDate as shown below.
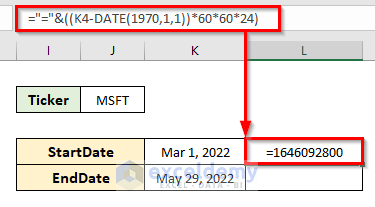
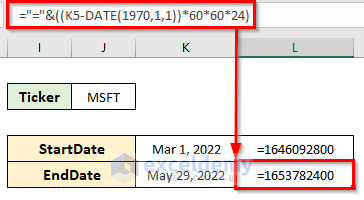
- Select L4. Enter the following formula:
="="&((K4-DATE(1970,1,1))*60*60*24)- Press Enter.
- The command converts the date of K4 into a timestamp.
- Enter the following formula in L5:
="="&((K5-DATE(1970,1,1))*60*60*24)- Press Enter.
- This is the output.
- Set Ticker to J2.
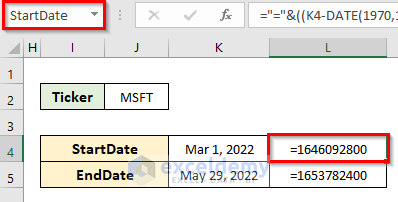
- Set StartDate to L4.
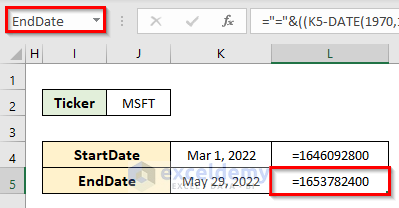
- Set EndDate to L5.
STEP 3: Import Stock Prices in a Dynamic Way
- Go to Query.
- Select Edit.
- A new dialog box will open.
- Go to the Home tab and select ‘Advanced Editor’.
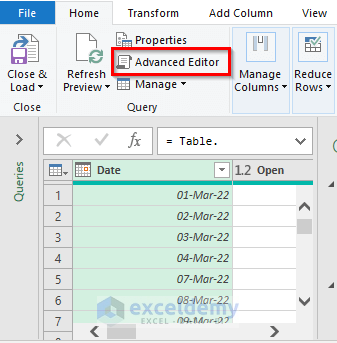
- In ‘Advanced Editor’ the following code will be displayed:
let
Source = Csv.Document(Web.Contents("https://query1.finance.yahoo.com/v7/finance/download/"&Ticker&"?period1"&StartDate&"&period2"&EndDate),[Delimiter=",", Columns=7, Encoding=1252, QuoteStyle=QuoteStyle.None]),
#"Promoted Headers" = Table.PromoteHeaders(Source, [PromoteAllScalars=true]),
#"Changed Type" = Table.TransformColumnTypes(#"Promoted Headers",{{"Date", type date}, {"Open", type number}, {"High", type number}, {"Low", type number}, {"Close", type number}, {"Adj Close", type number}, {"Volume", Int64.Type}})
in
#"Changed Type"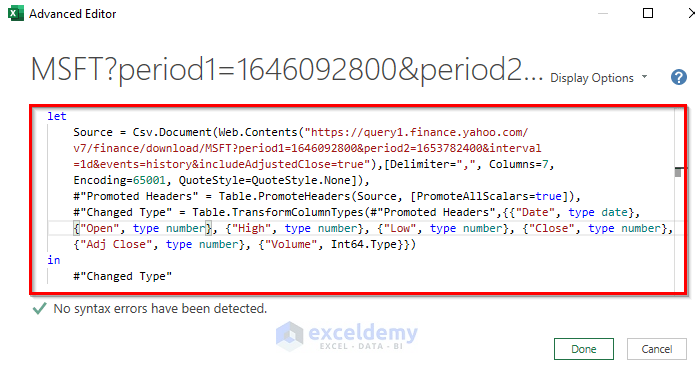
- Add Tickers, StartDate, and EndDate to the code:
let
Ticker = Excel.CurrentWorkbook(){[Name="Ticker"]}[Content]{0}[Column1],
StartDate = Excel.CurrentWorkbook(){[Name="StartDate"]}[Content]{0}[Column1],
EndDate = Excel.CurrentWorkbook(){[Name="EndDate"]}[Content]{0}[Column1],
Source = Csv.Document(Web.Contents("https://query1.finance.yahoo.com/v7/finance/download/"&Ticker&"?period1"&StartDate&"&period2"&EndDate),[Delimiter=",", Columns=7, Encoding=1252, QuoteStyle=QuoteStyle.None]),
#"Promoted Headers" = Table.PromoteHeaders(Source, [PromoteAllScalars=true]),
#"Changed Type" = Table.TransformColumnTypes(#"Promoted Headers",{{"Date", type date}, {"Open", type number}, {"High", type number}, {"Low", type number}, {"Close", type number}, {"Adj Close", type number}, {"Volume", Int64.Type}})
in
#"Changed Type"- Click Done.
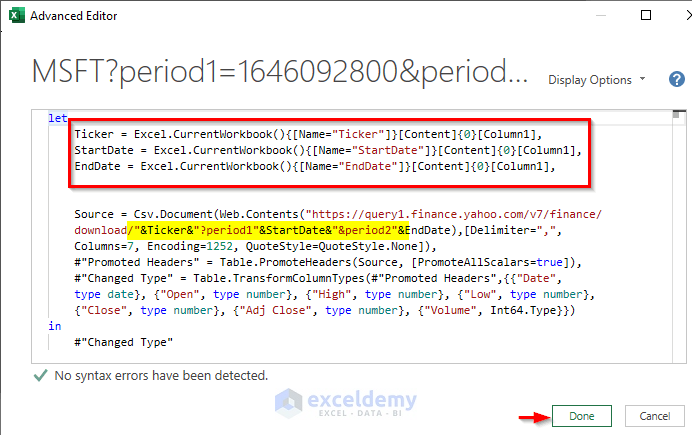
- Adjust the query code as shown in the highlighted part of the above image.
- Click ‘Close & Load’.
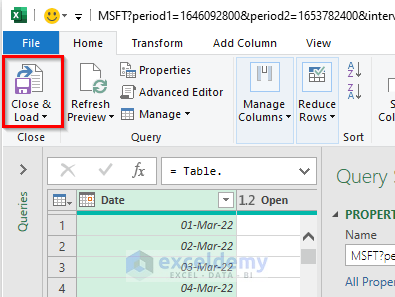
- The code will be updated in the worksheet.
- Set Ticker value to AAPL. Ticker represents Apple, here.
- Go to the Data tab and click Refresh All.
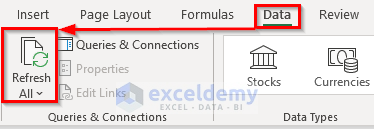
See the historical stock prices for Apple.
Download Free Template
Download the free template here.
Related Articles
<< Go Back to Stocks In Excel| Excel for Finance | Learn Excel
Get FREE Advanced Excel Exercises with Solutions!

Very useful and clear tutorial.
Hi
I tried this query for Indian market(NSE) , it is giving Error ( Expression Error Column1 not found), plz help
Hi NAYAZ,
Thanks for following our article. We have checked the article again and found no errors. Please go through the whole article again and create the template. Or you can do this easily by downloading the given template.
Keep in mind that if you want to import stock prices from any other website, then it will not work. You should use “^NSEI” in the ticker box.
Let us know if your problem is fixed.
Regards.
-Alok Paul
Author at ExcelDemy
Hi Mukesh- what changes to the code are necessary to change the interval from daily to weekly? Thank you, Brian J
Thank you BRIAN for your wonderful question
If you want to import stock prices on a weekly basis, you can visit this website link, from which we scraped our live data in accordance with this article.
Then, click on the Frequency option and select Weekly for your desired frequency.
Finally, apply the rest procedures mentioned in the article. I hope this may solve your issue.
Bishawajit, on behalf of ExcelDemy
Good Day, Thank you for your expertise Sir. I’m having the same issue where I’d like to create weekly and monthly sheets. Everything is fine until I get to the step to enter the code in the advanced editor.
It can be imported from the URL in a monthly price format, but as soon as the advanced editor code is loaded, it defaults right back to daily prices. Would you be so kind as to offer any suggestions Sir? Thank you so much.
Hello JACK MACEY,
I understand you are facing issues while creating the weekly and monthly sheets using the same given code. The provided code works perfectly for Daily frequency. But for Weekly and Monthly intervals, you have to adjust the parameter of the frequencies in the code accordingly.
In this line below, we have declared the parameter of the frequency.
We have to add the interval=1wk or interval=1mo parameters to the URL, which specify the Weekly and Monthly intervals.
Here are the modified codes.
For Weekly frequency,
And for Monthly frequency,
Try this way. And, let me know if it works.
Regards,
Yousuf Khan Shovon
Thank you for taking the time to respond Sir. Unfortunately, when I follow the instructions, select monthly, then copy the link address to input into the code, the sheet always loads prices for every day. I’m not sure what to change to fix it. The link I copy from yahoo finance is for the monthly frequency.
Thank you again for your expertise in helping to solve this issue.
Thank you JACK MACEY, for your wonderful question
If you want to import stock prices on a daily, weekly, monthly basis, you can visit this website link, from which we scraped our live data in accordance with this article.
Then, click on the Frequency option and select whatever you want for your desired frequency.
Finally, apply the rest procedures mentioned in the article. I hope this may solve your issue.
Bishawajit, on behalf of ExcelDemy
Hi this is amazing! Thank you very much.
I wanted to ask if it’s possible to import in only one sheet the historical data for more than one ticker. Instead of creating 50 different sheets for each ticker, I want one sheet where it importsthe price for 50 tickers? Is this possible? How can I do this?
Hi NICOLÁS,
Thanks for following our article. Please go through the whole article and create the template. And, you can use one ticker for only one sheet to import stock prices from any other website.
Let us know if your problem is fixed.
Regards,
Bishawajit Chakraborty
Author at ExcelDemy
Thank you very much, this will help me alot if I can solve the issue with the following msg
Expression.Error: The name ‘Ticker’ wasn’t recognized. Make sure it’s spelled correctly.
Please write Ticker correctly both in your xlsx file and the code. Do not try to give invalid ticker or outdated ticker. Provide problems in detail for better service please.
This is really amazing,
Now I need your generous advice as I tried to copy the same to new sheets from the same workbook but everytime it reads only from the first sheet.
I need this code to download at least 10 different tickers in different sheets of the same workbook
First, you have to create different power queries for each worksheet for other tickers and copy the same code. Otherwise, it triggers the first. Then for 10 different tickers,the code is
this code creates 10 tables for 10 different tickers. You have to select one table according to Ticker and hover over the query in Workbook Query Section and press View in Worksheet. You will get the table have to create 10 sheets separately.
I have a question regarding max and min function used in query. Like how to fetch only maximum value in particular column instead of whole table. Is there any way around?
I have a question about how to include max or min function in query. I want maximum value of close price in defined period instead of whole table. Is there any way to find max value?
Hello PCLOUD
Greetings from our website! Thank you for sharing your question on the platform. There is a way to resolve your submitted query of finding the maximum value of the Close price in a defined period instead of the whole table. I can assist you with an Excel PowerQuery code to reach your goal.
PowerQuery Code:
The line MaxClosePrice = List.Max(#”Changed Type”[Close]) calculates the maximum value of the Close column in the transformed table. The result is assigned to the variable MaxClosePrice.
I hope this will achieve your goal. I am also giving you the Workbook used to investigate your issue to help you understand better. Feel free to contact us again with any other inquiries or concerns.
WORKBOOK:
DOWNLOAD WORKBOOK
Regards
Lutfor Rahman Shimanto
ExcelDemy Team
This is an absolutely phenomenal piece of code. I’m having trouble doing one thing with it though. I’m trying to create the same sheet but only pull the historical dividend information. I use the following code to pull two columns, “Date”, and “Dividends”, but the code always returns an error
“Expression.Error: The column ‘Dividends’ of the table wasn’t found.
Details:
Dividends”
Do you have any suggestions that could solve this problem. The following is the code. Thank you so much 🙂
let
Ticker = Excel.CurrentWorkbook(){[Name=”Ticker”]}[Content]{0}[Column1],
StartDate = Excel.CurrentWorkbook(){[Name=”StartDate”]}[Content]{0}[Column1],
EndDate = Excel.CurrentWorkbook(){[Name=”EndDate”]}[Content]{0}[Column1],
Source = Csv.Document(Web.Contents(“https://query1.finance.yahoo.com/v7/finance/download/”&Ticker&”?interval=1d&period1″&StartDate&”&period2″&EndDate),[Delimiter=”,”, Columns=2, Encoding=65001, QuoteStyle=QuoteStyle.None]),
#”Promoted Headers” = Table.PromoteHeaders(Source, [PromoteAllScalars=true]),
#”Changed Type” = Table.TransformColumnTypes(#”Promoted Headers”,{{“Date”, type date}, {“Dividends”, type number}})
in
#”Changed Type”
Dear NORTH80,
Thank you very much for reading our articles.
You have mentioned that, when pulling historical dividend information you faced a problem. The problem is:
“Expression.Error: The column ‘Dividends’ of the table wasn’t found.
Details:
Dividends”
Here is the modified query code to solve the mentioned problem.
If you face further problems, please write in the comment box.
Best Regards,
Alok Paul
Team ExcelDemy
Hi.
For me “https://query1.finance.yahoo.com/v7/finance/download/…..” is not working anymore.
I got the msg saying the following “we were not able to authenticate with the identification informations given”.
Everything was working fine until the 6th September 2024.
Does anybody else have the same problem ?
Has Yahoo stopped the service for query ?
Hello Franck,
Yahoo Finance has recently changed its API access, leading to authentication failures for many users starting around September 6, 2024. Users are encountering errors such as “unauthorized” or “not found,” it seems that Yahoo has either restricted the free access to its data or implemented new authentication methods.
You can use the alternatives STOCKHISTORY function in Excel (for Office 365 users) or exploring paid options from Yahoo may be necessary.
Regards
ExcelDemy
Thank you Shamina but I don’t have Office 365.
Hello Franck,
You are most welcome. Since you don’t have Office 365, you can try using Google Sheets with the GOOGLEFINANCE function to import financial data for free, or explore third-party APIs like Alpha Vantage. These are good alternatives to the STOCKHISTORY function in Excel.
Regards
ExcelDemy