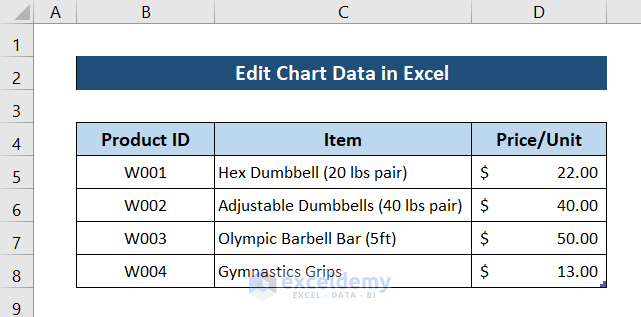
How to Create a Chart Based on Data in Excel
If you want to change the chart Data Range automatically with the modifications of rows/columns, change the dataset to a table. This way, you won’t need to manually update the chart every time you insert or delete a new row/ column.
To convert the dataset to an Excel table:
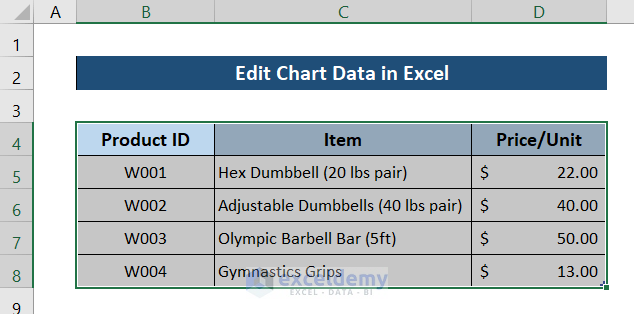
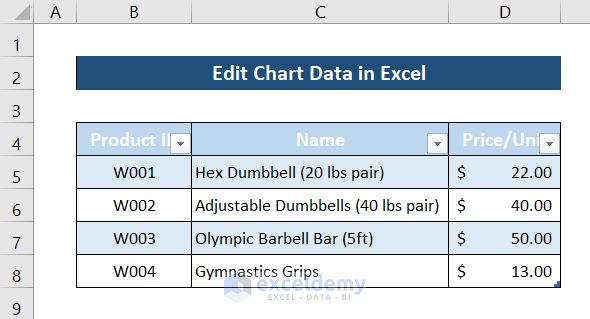
- Select the whole dataset.
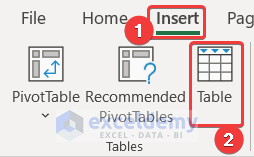
- Go to the Insert tab from your ribbon and click on Table from the Table group.
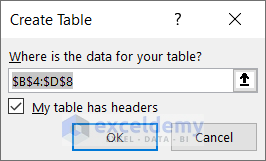
- A Create Table box will open. Make sure the My table has headers option is checked. Click on OK.
The dataset will be converted into an Excel table.
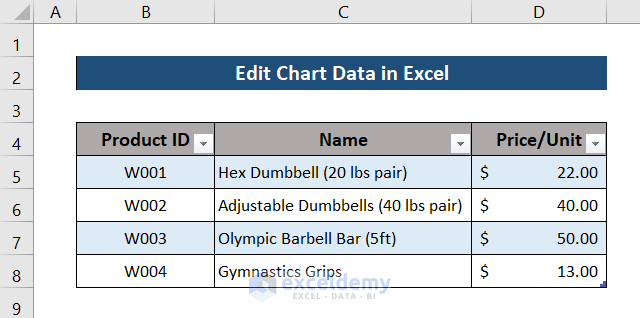
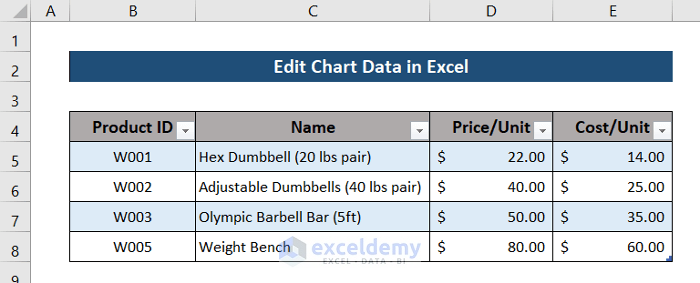
After some modifications, the table will look like this.
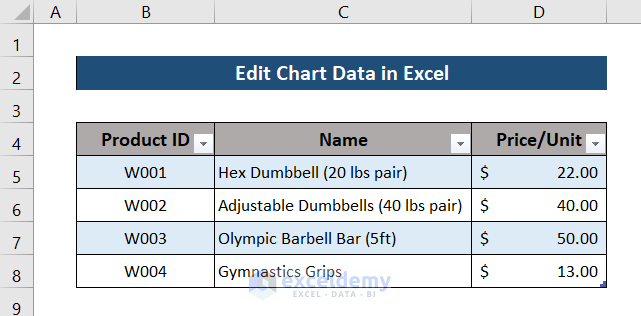
This is our final table which will serve as our chart data.
To create a chart out of it:
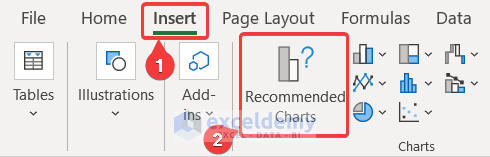
- Select a cell in the table.
- Go to the Insert tab from your ribbon and under the Charts group, select Recommended Charts.
- The Insert Chart box will open. Select the chart type you want from this box. We have selected Clustered Column under the Recommended Charts Click on OK.
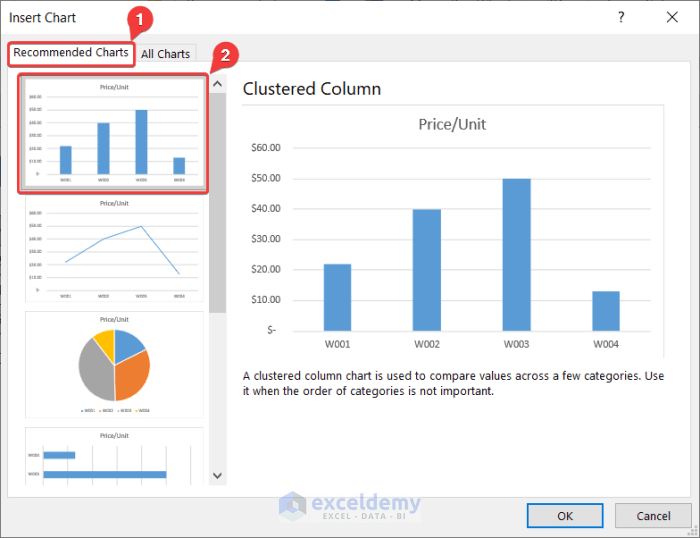
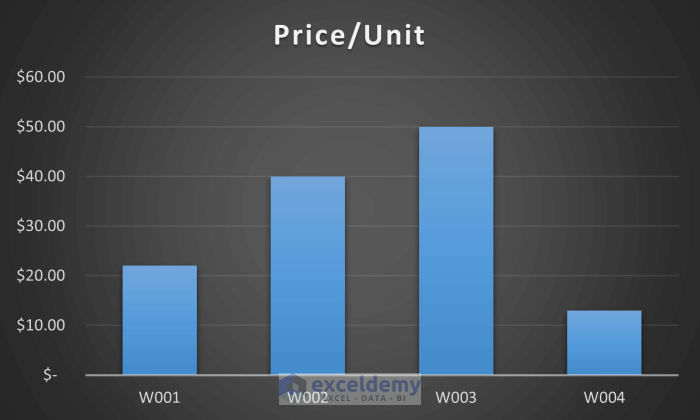
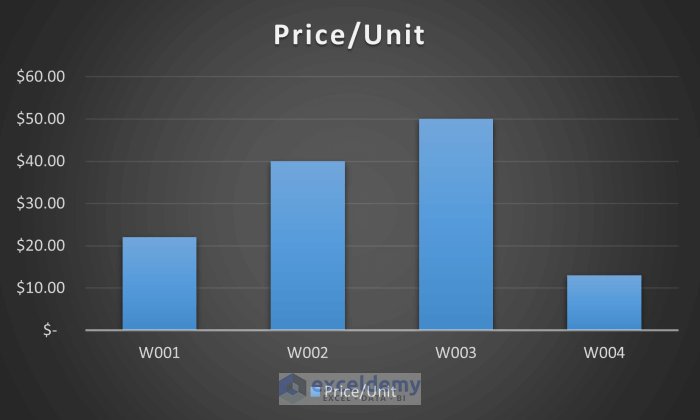
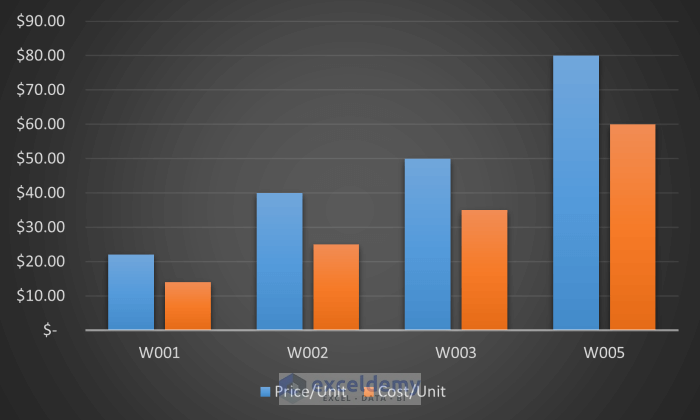
A column chart or bar chart will appear on the spreadsheet.
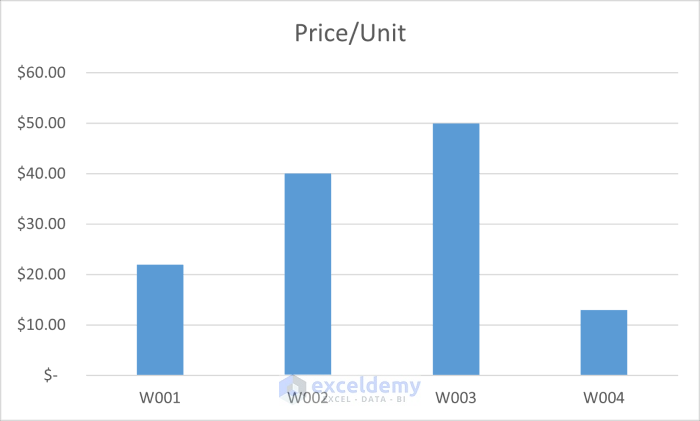
You can customize your chart as required.
All the methods/ examples will work regardless of the chart type if you have converted the dataset into a table and have selected the chart type.
Example 1 – Modifying Excel Chart Data
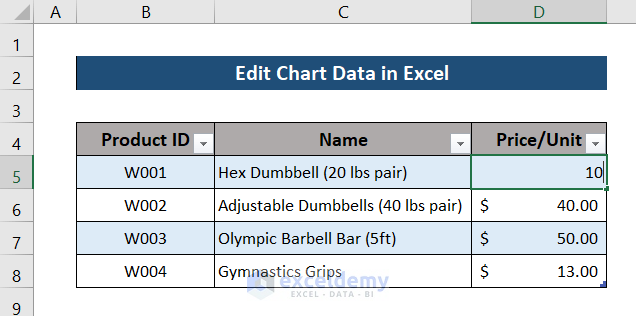
We will see how to modify the chart by editing chart data within it. Suppose, the price/unit of the first product in our table has gone down, from $22 to $10. Changing the value will automatically update the chart.
Change the value by entering 10 in cell D5.
You will see the change in the chart instantly.
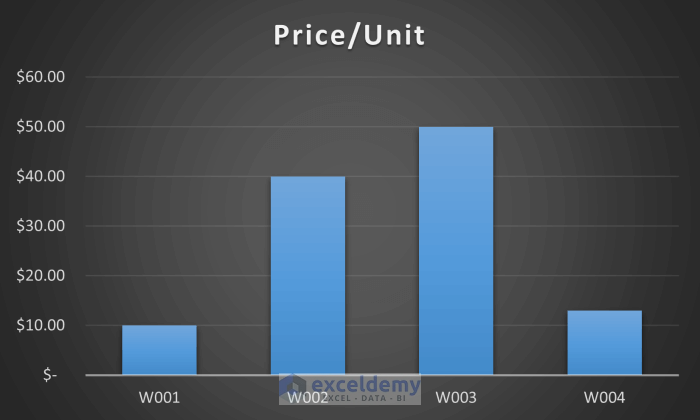
Compare this graph with the one in the previous section. You will notice the height of the first column shortened.
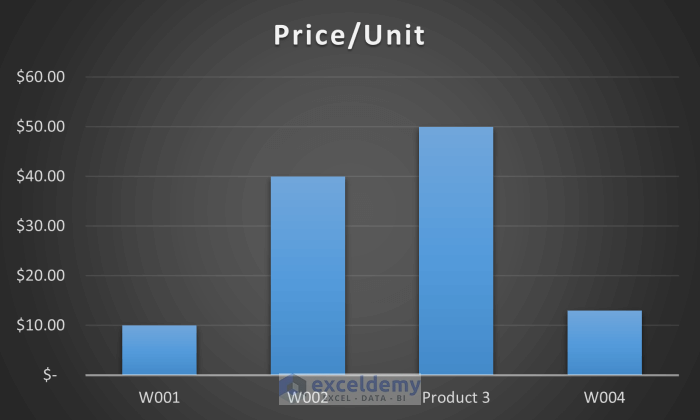
Changing any values, that are present in the graph will change the chart. Changing the ID of the product will automatically update the chart as well.
We will change the cell value of cell B7 to “Product 3”.
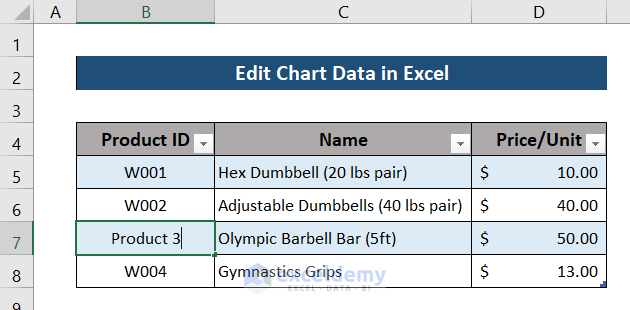
The value of the third entry will change accordingly.
Read More: How to Change Data Source in Excel Chart
Example 2 – Editing Chart Data by Adding New Values in Excel
To add new values such as columns/rows, you need to make some modifications so that the table automatically adds new rows/ columns in the table.
Steps:
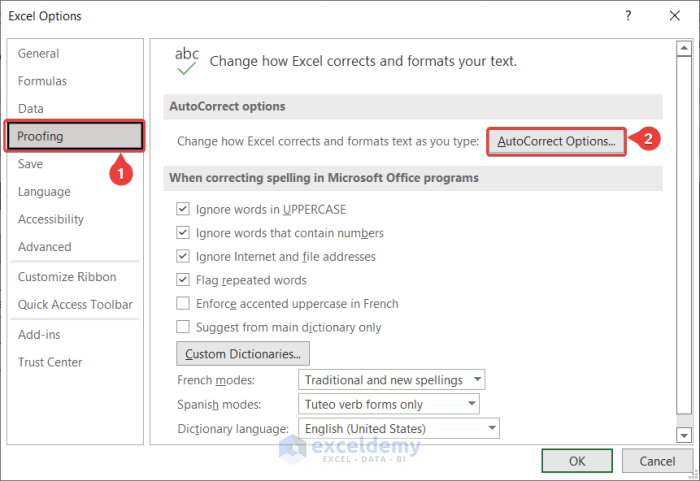
- Go to the Excel Options by clicking on the File tab and select Options.

- In the Excel Options box, go to the Proofing tab and select Autocorrect Options.
- Ensure that the options shown in the following image are checked in the AutoFormat As You Type tab of the Autocorrect box.
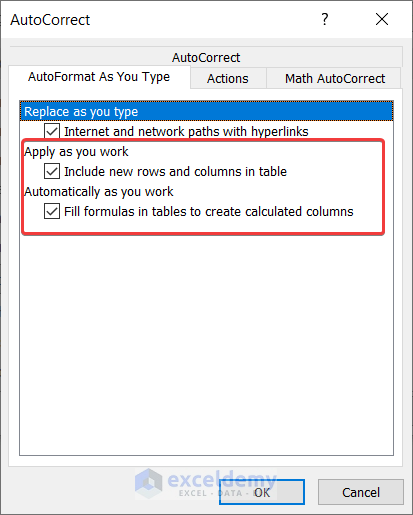
- Click on OK in both the boxes.
- Excel will automatically add new rows/columns to the table as you keep entering data in the adjacent cells.
- To add a new value to a chart, add a new column to the table.
- Enter the header in cell E5.
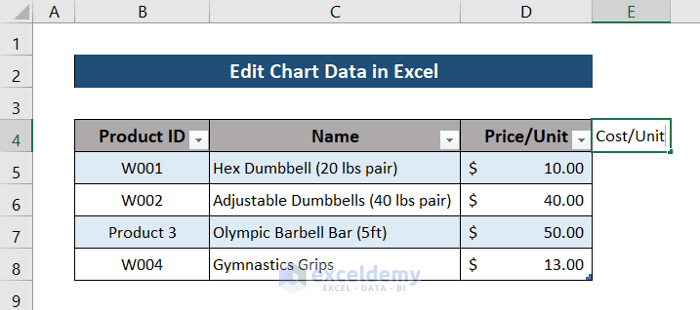
- Press Enter.
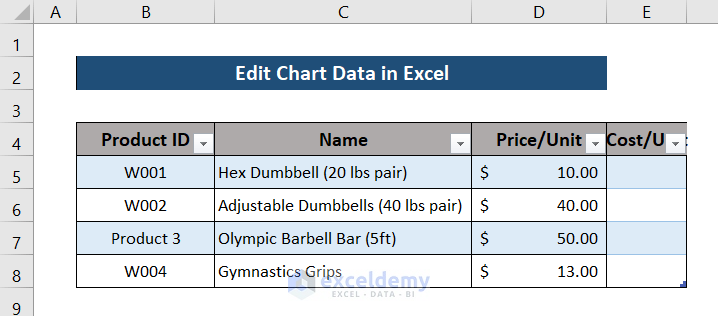
- A column will automatically be created with the formats applied in the table.
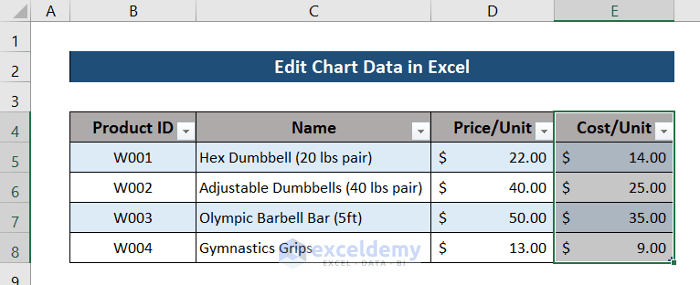
- Enter data in the new column.

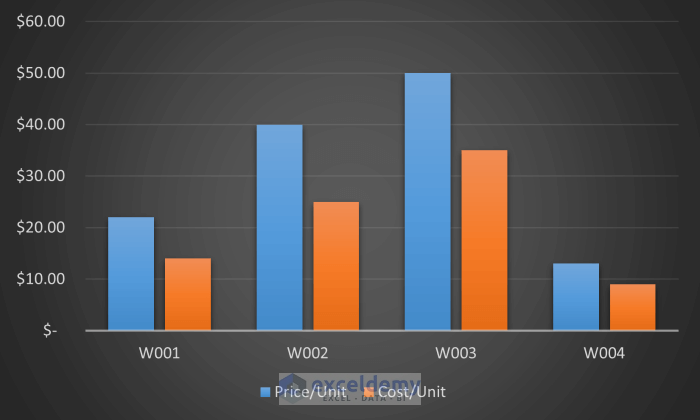
The new values will be added to the chart according to the chart data in Excel.
Read More: How to Change Chart Data Range in Excel
Example 3 – Removing Values from Chart Data
Steps:
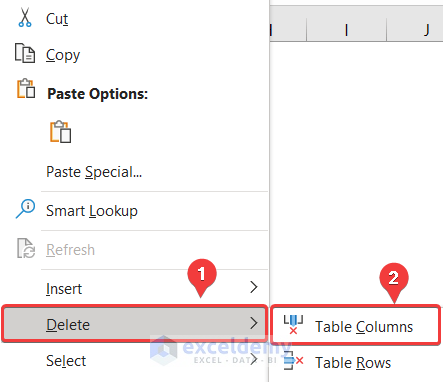
- Select the column you want to delete.
- Right-click on the column. A context menu will appear.
- Select Delete and select Table Columns.
The column will be deleted.
The chart will automatically be updated.
Read More: How to Edit Data Table in Excel Chart
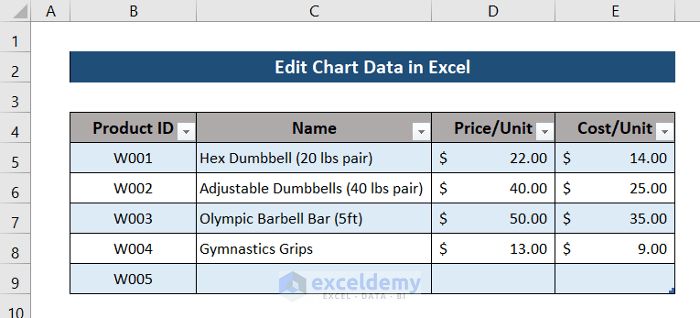
Example 4 – Adding New Rows to Chart Data
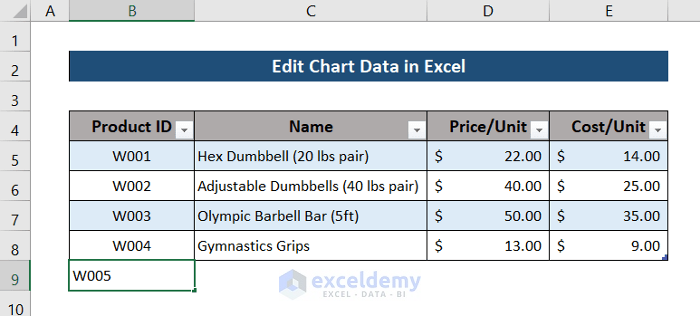
To add new rows to chart data, ensure that you have enabled the options to automatically add new rows/columns to the table as illustrated in the Example 2. Enter a new product id in cell B9 and press Enter.
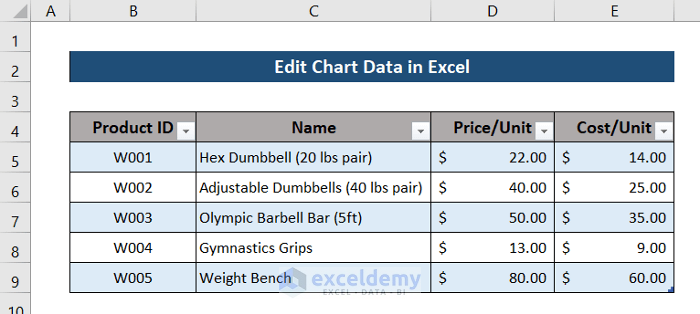
A new row will automatically appear at the end of the table.
Fill up the values in the row.
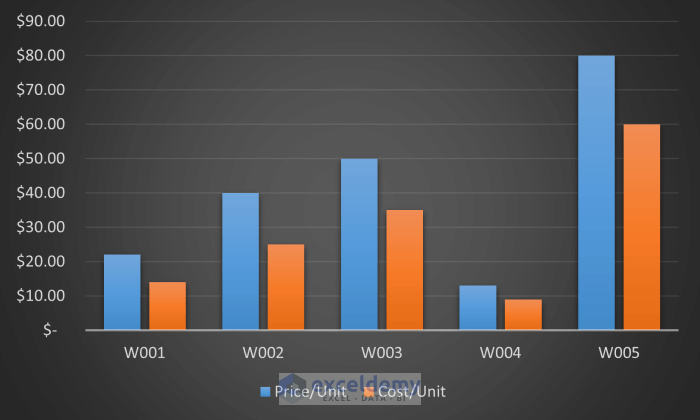
The chart will automatically have a new column at the end of it.
Example 5 – Removing Rows from Excel Chart Data
You can remove rows to remove columns in the chart.
Steps:
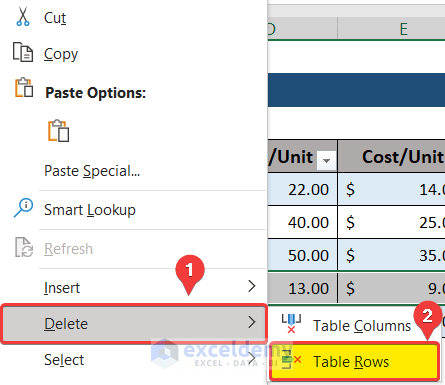
- Select the rows you want to remove. We have selected the range B8:E8.
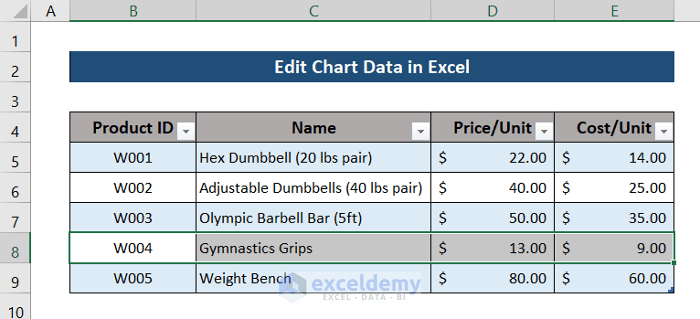
- Right-click on the row.
- Select Delete from the context menu and select Table Rows.
This will remove the row from the table.
The set of columns from the chart that represented the particular row will be removed.
Read More: How to Remove One Data Point from Excel Chart
Download Practice Workbook
Related Articles
- Change X-Axis Values in Excel
- Change Date Range in Excel Chart
- Add Data to an Existing Chart in Excel
- Add Data Points to an Existing Graph in Excel
- Expand Chart Data Range in Excel
<< Go Back to Excel Chart Data | Excel Charts | Learn Excel

