A data table helps to represent data more clearly in an Excel chart. If you are looking for a way of editing a data table in an chart then you have come to the right place. The objective of this article is to explain how to edit data table in Excel chart.
How to Edit Data Table in Excel Chart: 2 Simple Ways
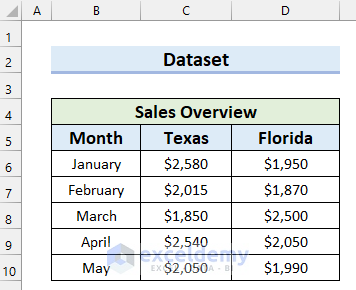
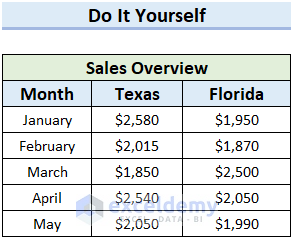
To explain this article, I have taken the following dataset. It contains Months and Sales in Texas and Florida. I will make an Excel chart with these data, add a data table to the chart and then show you how you can edit the data table in Excel chart.
1. Use Context Menu to Edit Data Table in Excel Chart
A Context Menu is a pop-up menu that appears on right-click operation. In this first method, I will use the Context Menu to edit data table in an Excel chart. Let’s see the steps of this method.
Step-01: Insert Chart in Excel
In this first step, I will insert a chart in Excel.
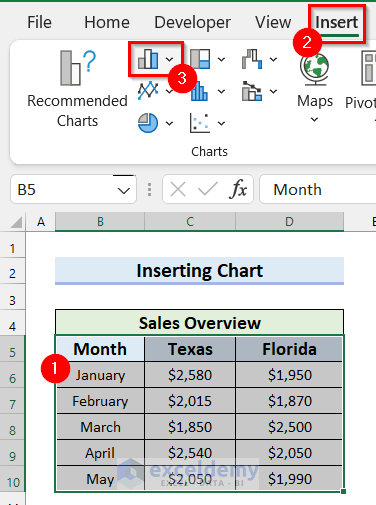
- Firstly, select the data range.
- Secondly, go to the Insert tab.
- Thirdly, select Insert Column or Bar Chart.
- After that, a drop-down menu will appear.
- Select Clustered Column from 2-D Column.

- Finally, you will see that you have inserted a chart for your selected data range.

Read More: How to Change Chart Data Range in Excel
Step-02: Add Data Table in Excel Chart
Here, I will add the data table to the Excel chart I inserted in the previous step.
- In the beginning, select the chart.
- Then, select Chart Elements.
- After that, check the Data Table option.
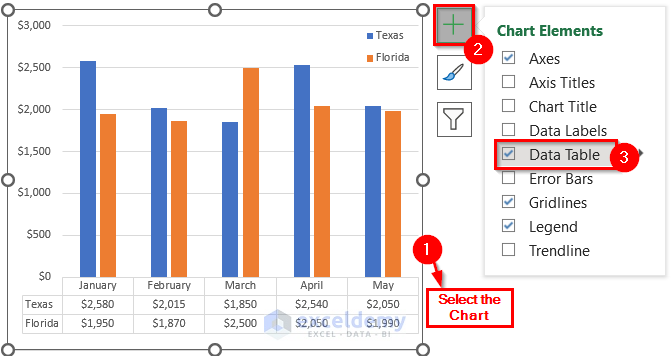
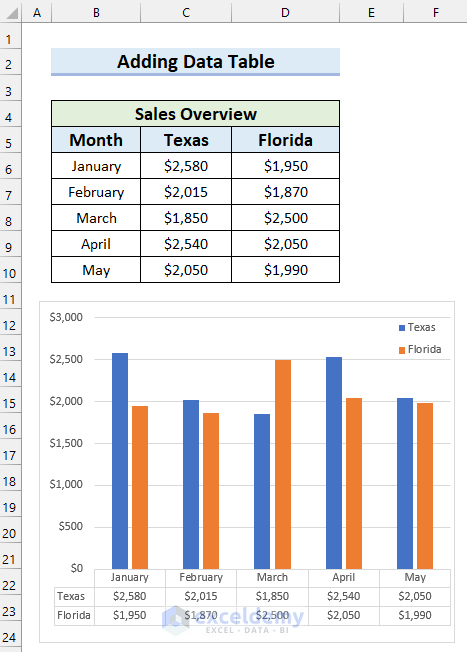
- Next, you will see that you have added a data table to your Excel chart.
Read More: How to Change Data Source in Excel Chart
Step-03: Edit Data Table Using Context Menu
Now, I will edit the data table using Context Menu in Excel.
- First, right-click on the data table.
- Secondly, select Format Data Table from the Context Menu.
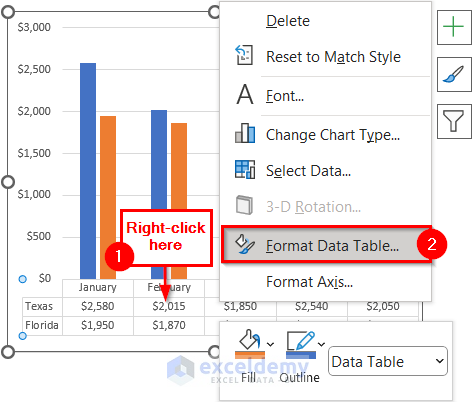
- After that, the Format Data Table task pane will appear on the right side of the screen.
- Then, uncheck the Horizontal option if you want to remove the horizontal lines.
- Next, uncheck the Vertical option if you want to remove the vertical lines.
- Afterward, check the Show legend keys option the see the legend keys in the data table.
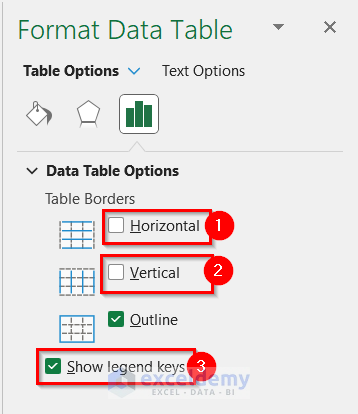
- Here, in the following picture, you can see how my data table looks after editing.

2. Employ Format Tab to Edit Data Table in Excel Chart
Here, I will use the Format tab from the Ribbon to edit data table in Excel chart. Let’s see the steps below.
Steps:
- To begin with, insert a chart following the procedures from Step-01 of Method-01.
- Then, add the data table following the procedures from Step-02 of Method-01.

- Next, select the data table.
- Afterward, go to the Format tab.
- Then, select Format Selection.
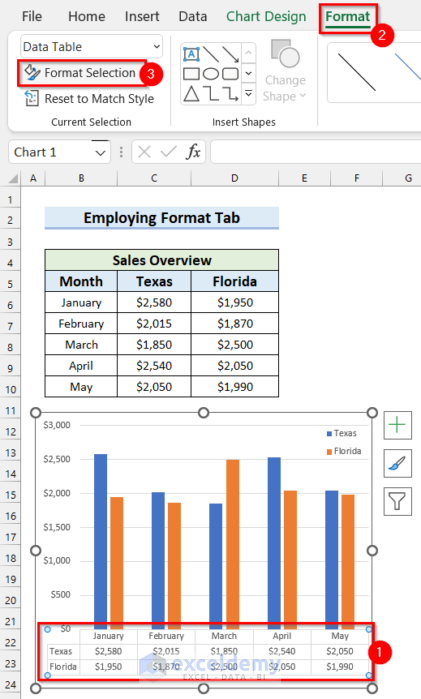
- Consequently, the Format Data Table task pane will appear on the right side of the screen.
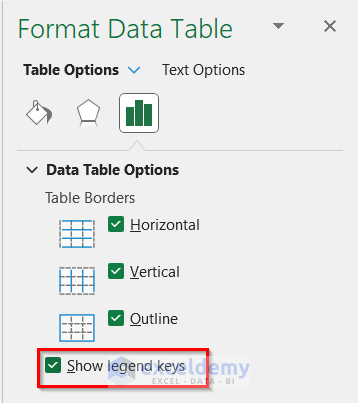
- Check the Show legend keys option to see the legend keys in the data table.
- After that, select the Text Options tab to edit the texts in the data table.
- Then, go to Text Effects.
- Next, select the drop-down option for the Color.
- Further, select the color you want as the Shadow.

- After that, select Text Fill & Outline.
- Then, select Text Fill.
- Next, select Gradient fill.

- Further, select Text Outline.
- Then, select the outline you want. Here, I selected the Solid line.
- Next, click on the drop-down option for the Color.
- After that, select the color you want for the outline.
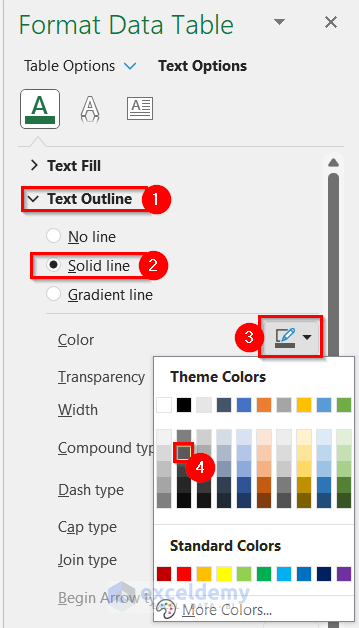
- In the following picture, you can see my final data table after editing.

Practice Section
Here, I have provided a practice sheet for you to practice.
Download Practice Workbook
You can download the practice workbook from here.
Conclusion
To conclude, I tried to cover how to edit data table in Excel chart in 2 simple ways. I hope this article was clear to you. If you have any questions, feel free to let me know in the comment section below.
Related Articles
- How to Edit Chart Data in Excel
- How to Change X-Axis Values in Excel
- How to Change Chart Data Range Automatically in Excel
- How to Sort Data in Excel Chart
- How to Group Data in Excel Chart
- How to Limit Data Range in Excel Chart
- How to Skip Data Points in an Excel Graph
- How to Remove One Data Point from Excel Chart
- How to Hide Chart Data in Excel
- How to Ignore Blank Cells with Formulas in Excel Chart
<< Go Back to Edit Chart Data | Excel Chart Data | Excel Charts | Learn Excel
Get FREE Advanced Excel Exercises with Solutions!
