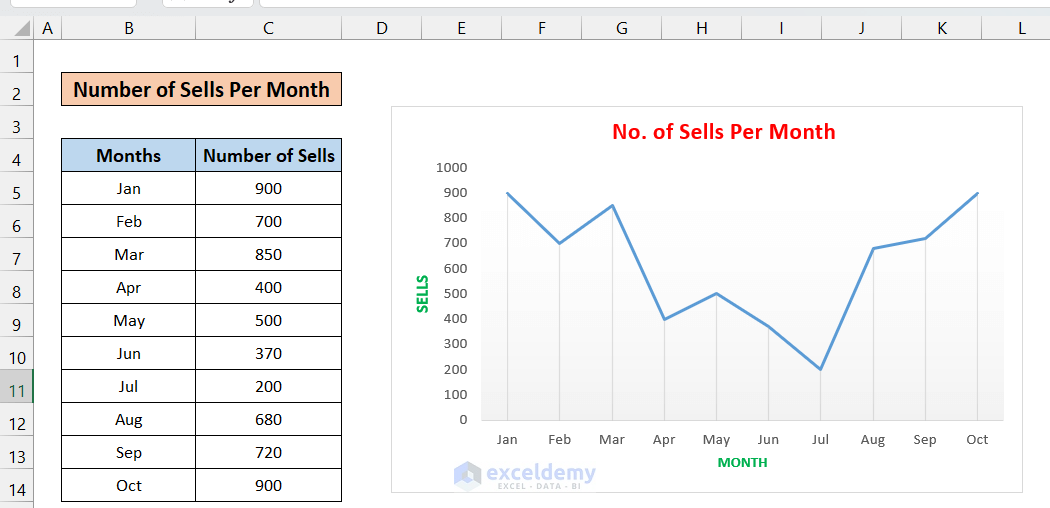
In this line chart, we have some hypothetical sales data for an imaginary shop for the first 10 months of a year. We want to remove one data point from the chart (such as June).
Method 1 – Use a Filter to Remove One Data Point
Steps:
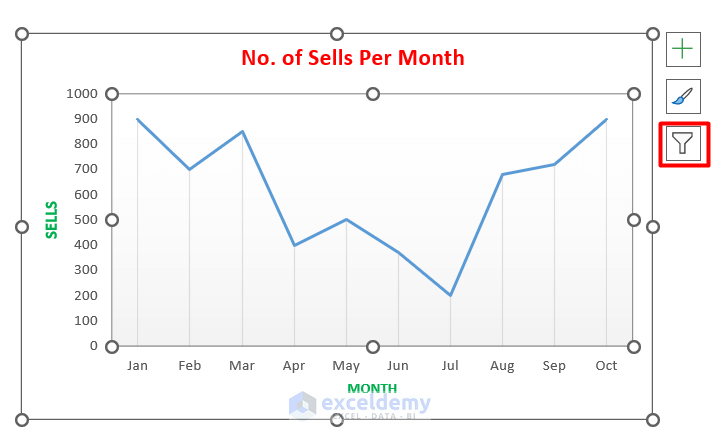
- Left-click on the chart. You will see a menu bar on the right side of the chart.
- Select the Chart Filters option.
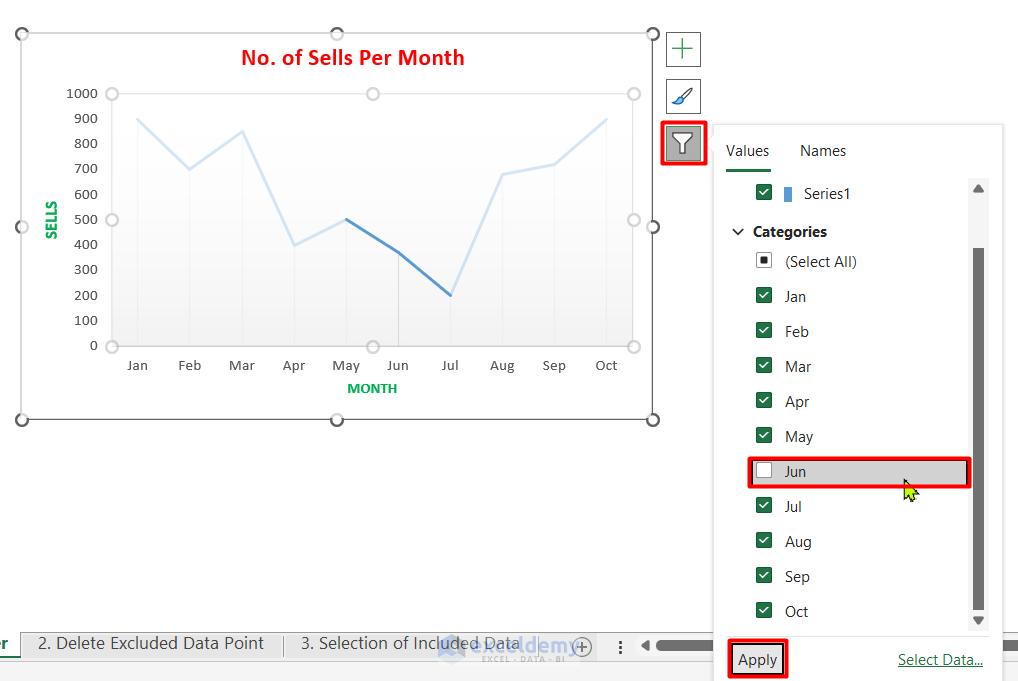
- You will get a menu that contains Categories (with month names in our sample).
- Deselect the month that you want to remove from the Excel chart. We have deselected Jun.
- Click on Apply.
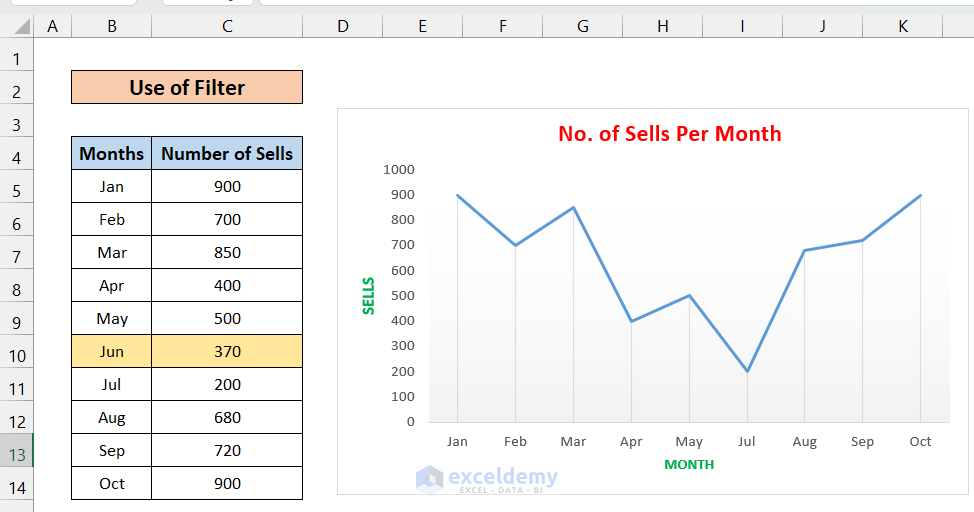
- The data point is no longer being plotted on the chart.
Read More: How to Skip Data Points in an Excel Graph
Method 2 – Delete Data to Remove It from Excel Chart
Steps:
- We want to exclude the Jun data point.
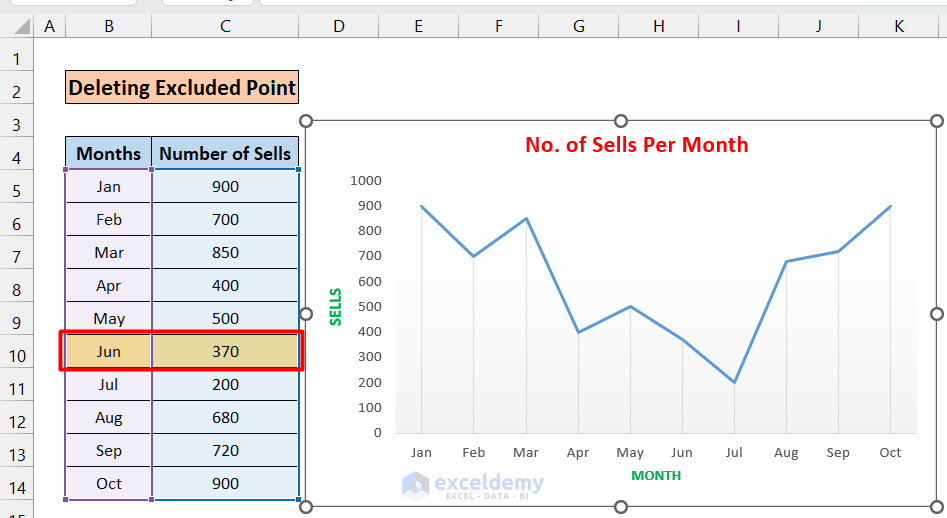
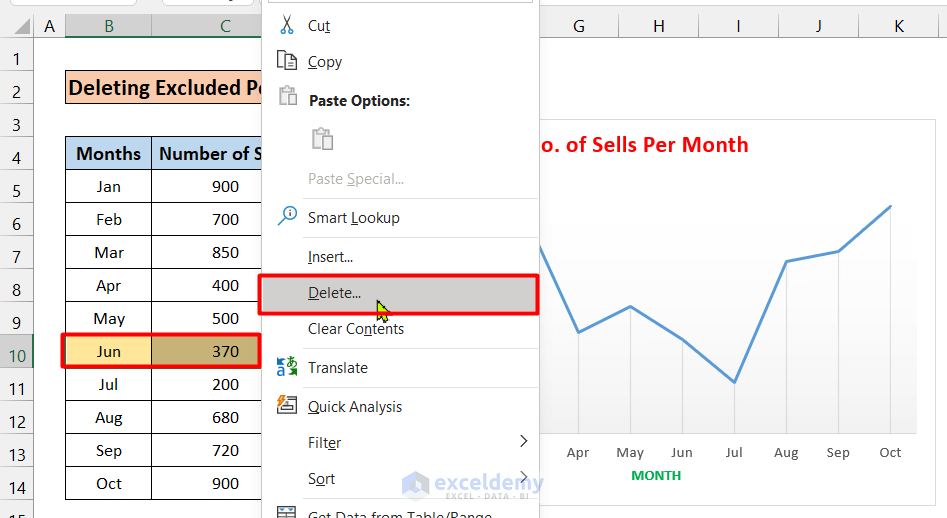
- Select the row containing Jun on the table and right-click.
- From the context menu, click on Delete.
- From the Delete dialog, select Shift cells up and click OK.
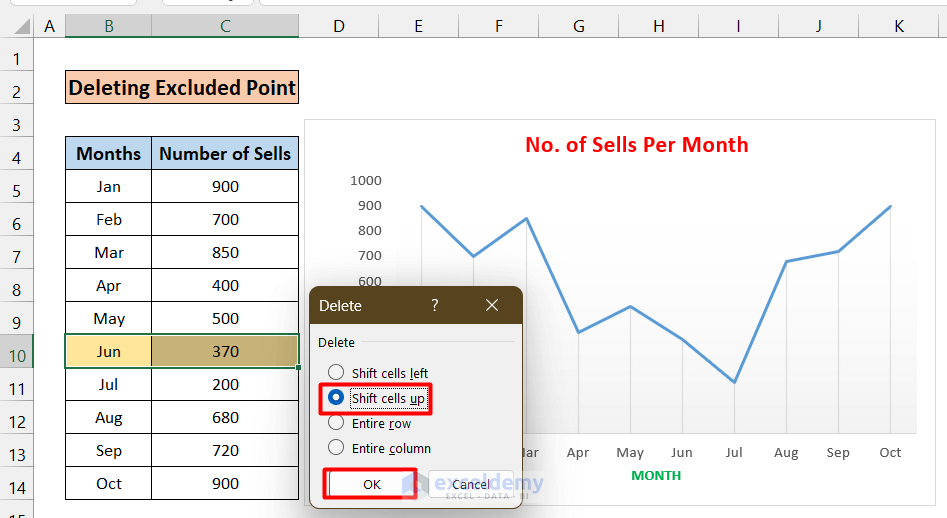
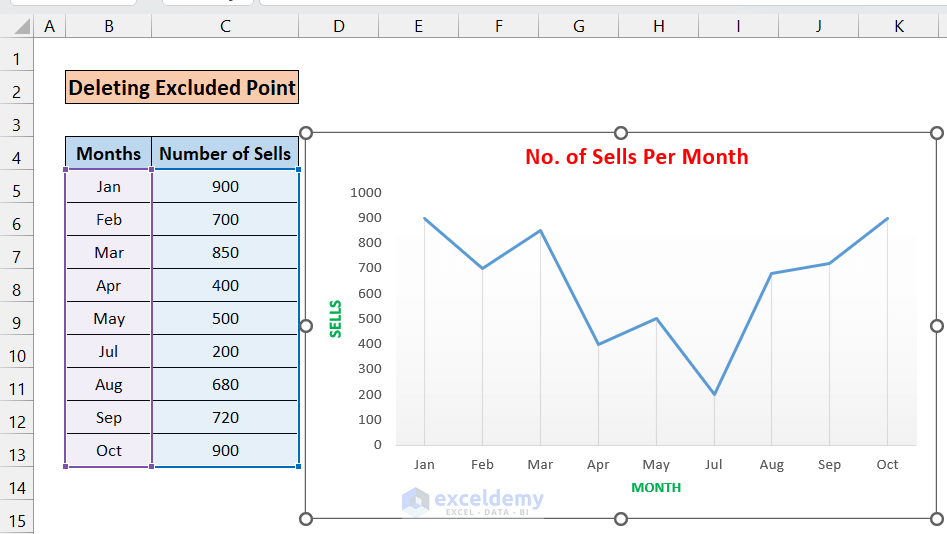
- The data point of June has been removed from the dataset and the accompanying chart.
Read More: How to Edit Chart Data in Excel
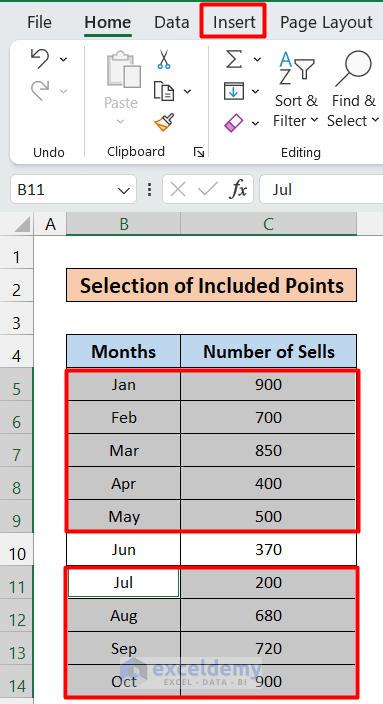
Method 3 – Select Only Data Points to Include
Steps:
- Select the data above June (January to May).
- While holding the Ctrl key, select the rows below June (July to October).
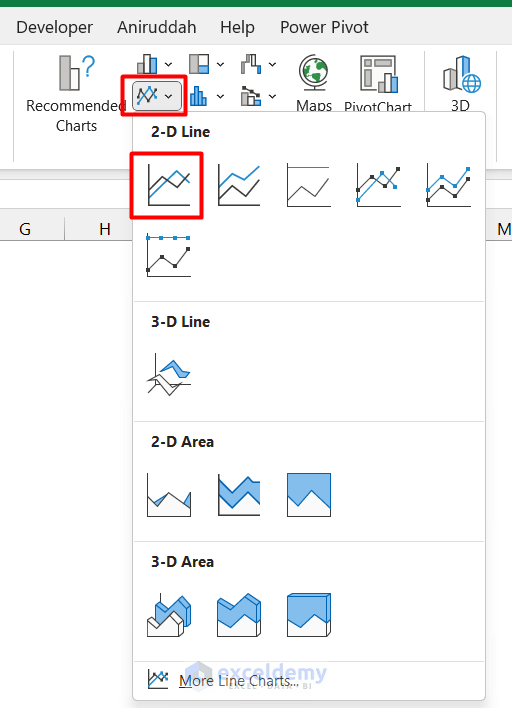
- Go to the Insert tab from the ribbon.
- Select any chart style you like. We have chosen the 2D line chart.
- You will have an Excel chart without the data point for June.
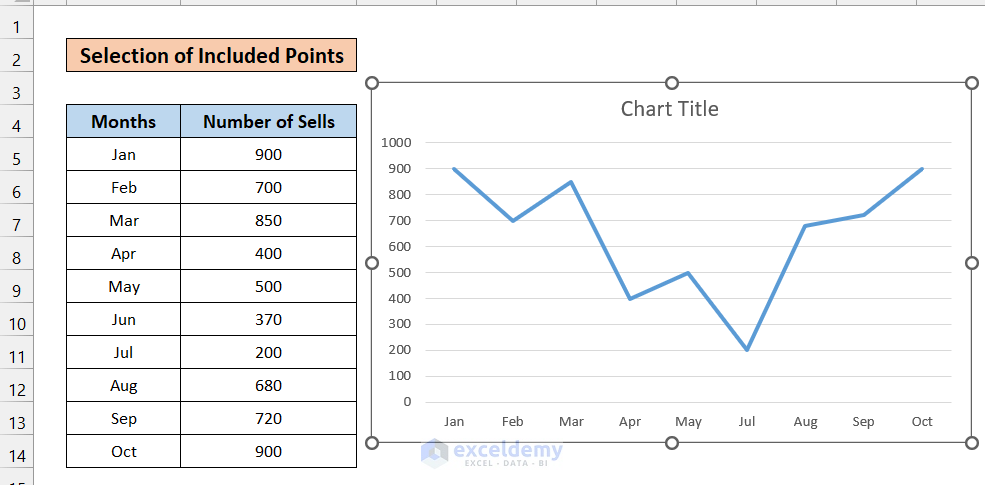
- You can customize the table as you wish.
Read More: How to Limit Data Range in Excel Chart
Download the Practice Workbook
Related Articles
- How to Change Chart Data Range in Excel
- How to Edit Data Table in Excel Chart
- How to Change Data Source in Excel Chart
- How to Change X-Axis Values in Excel
- How to Change Chart Data Range Automatically in Excel
- How to Sort Data in Excel Chart
- How to Group Data in Excel Chart
- How to Hide Chart Data in Excel
<< Go Back to Edit Chart Data | Excel Chart Data | Excel Charts | Learn Excel
Get FREE Advanced Excel Exercises with Solutions!
