Basics of Linear Regression
Regression Analysis is a part of Statistics which helps to predict values depending on two or more variables. Linear Regression helps to estimate values between a single independent and dependent variable.
The equation used is :
Y = mX + C + EY = Dependent Variable
m = Slope of the Regression Formula
X = Independent Variable
Ε = The Error which is the difference between the actual value and predicted value.
The error term, E is in the formula because no prediction is fully accurate. Though some Add-ins calculate errors off-screen, we mention it to clarify the analysis. However, the Linear Regression formula becomes Y=mX+C, if we ignore the error term.
4 Ways to Do Linear Regression in Excel
Method 1 – Using Analysis ToolPak to Do Linear Regression
Steps:
- Go to File.
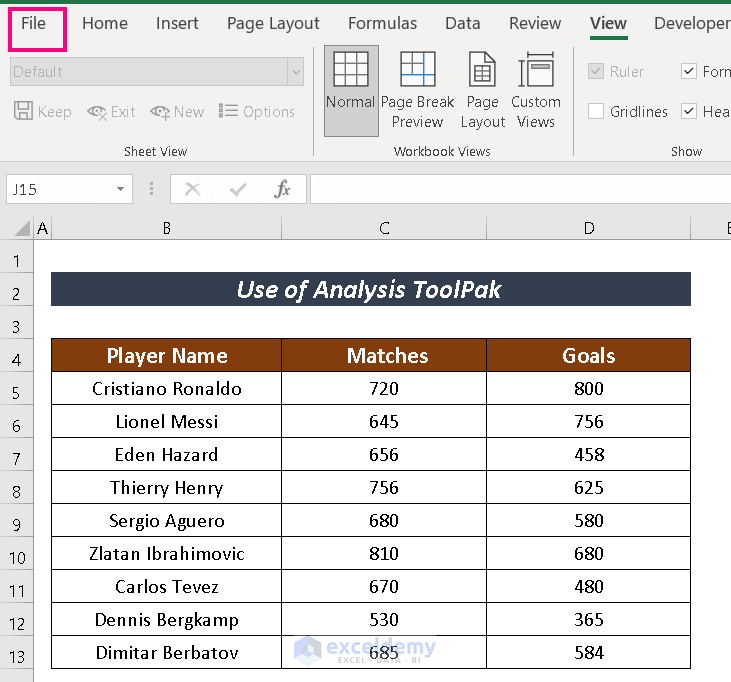
- Select Options.

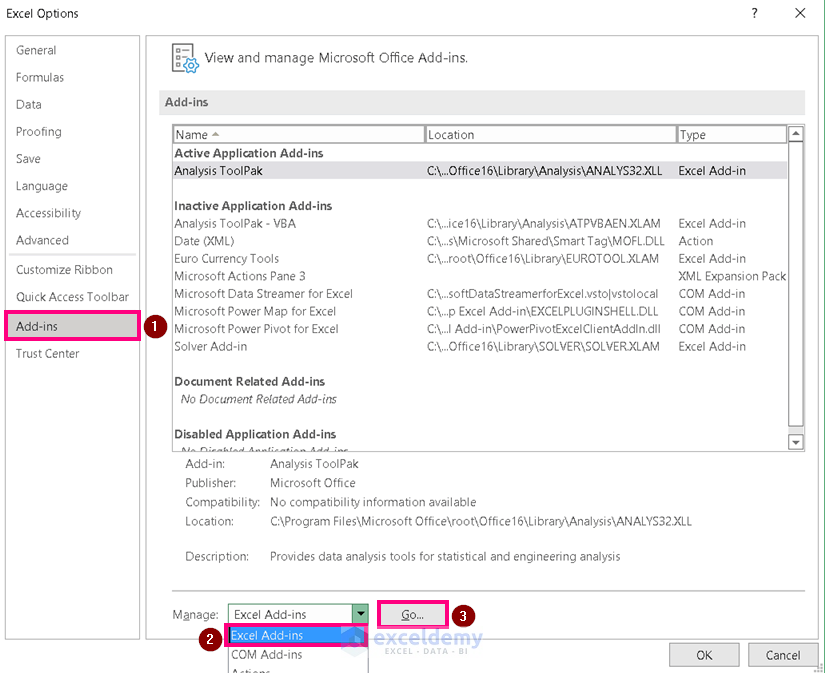
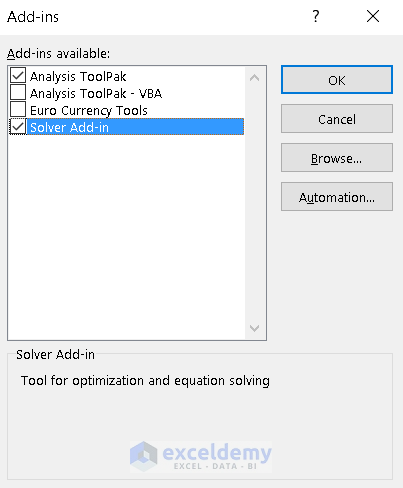
- Click on Add-ins.
- Choose Excel Add-ins and click on Go.
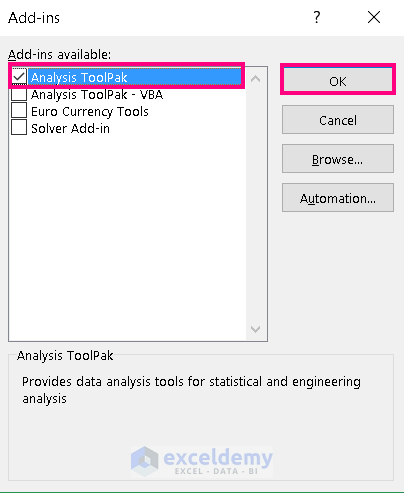
- Check one Add-in at a time and click OK.
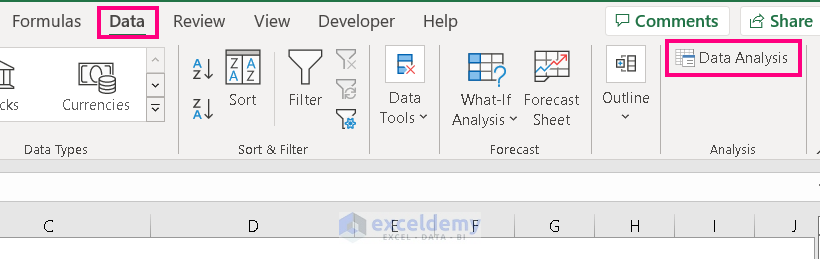
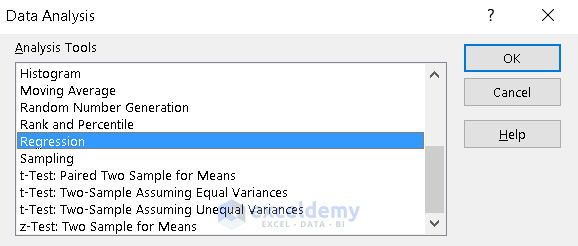
- Go to Data —> Data Analysis.
- From Analysis Tools, choose Regression and click OK.
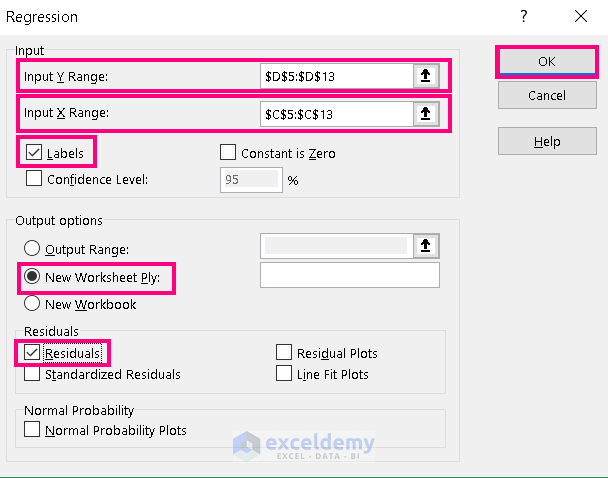
- Assign values in the Input Y Range ( D5:D13), Input X Range (i. e. C5:C13).
- Check the boxes named Labels, New Worksheet Ply and Residuals.
- Click OK.
Excel will output 4 major Linear Regression Analysis Outcomes in a new window.
4 Major Linear Regression Analysis Outcomes
- Regression Statistics: Regression Statistics is an array of various parameters that describe how well the measured Linear Regression is.
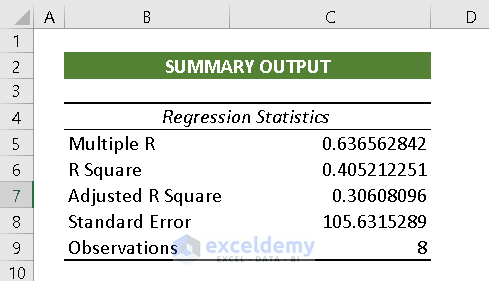
Multiple R: Multiple R is a Correlation Coefficient parameter that indicates the correlation between variables. Its value ranges from -1 to 1. The bigger positive the value, the stronger correlative the relationships are.
R Square: It symbolizes the Coefficient of Determination. It indicates the scale by how well the data model fits the Regression Analysis.
Adjusted R Square: The value of R^2 is used in multiple variables Regression Analysis.
Standard Error: Another parameter that shows a healthy fit of any Regression Analysis. The smaller the Standard Error the more accurate the Linear Regression equation. It shows the average distance of data points from the Linear equation.
Observations: The number of iterations in the data model.
- ANOVA: It analyses the variance of the data model.
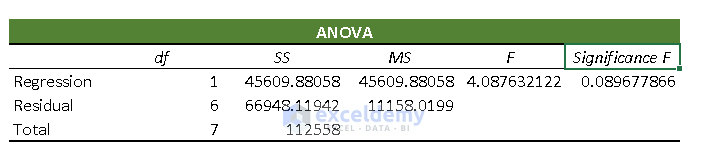
df: df expresses the Degrees of Freedom.
SS: SS (Sum of Squares) symbolizes the good to fit parameter.
MS: It means the Mean Square.
F: F refers to the Null Hypothesis. It tests the overall significance of the regression model.
Significance F: The P-Value of F.
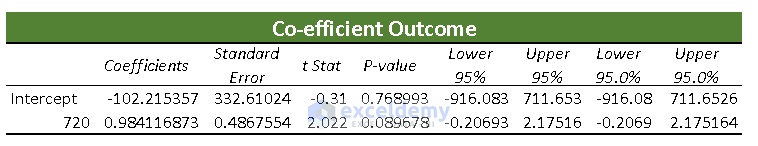
- Co-efficient Outcome: It helps to calculate the Y values quite easily.
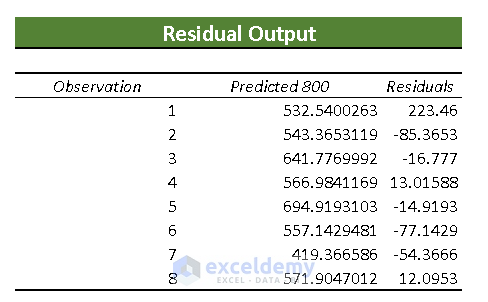
- Residual Output: It compares the estimated value with the calculated value.
Method 2 – Applying Excel Chart to Do Linear Regression
Steps:
- Select the cells to analyze. We have selected cells C4:D13.
- Go to Insert and click on Scatter.

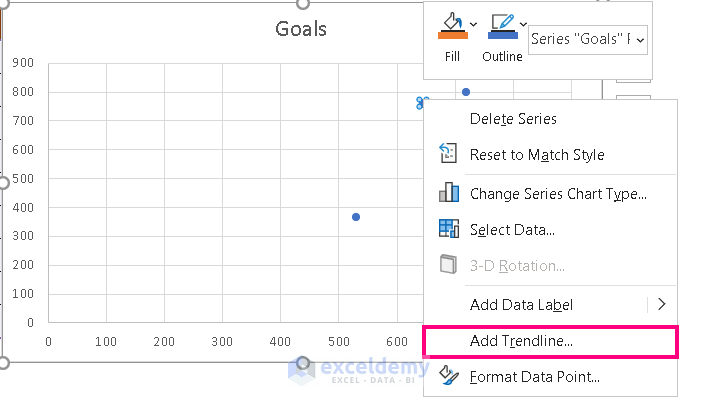
Excel will show the scattered point.
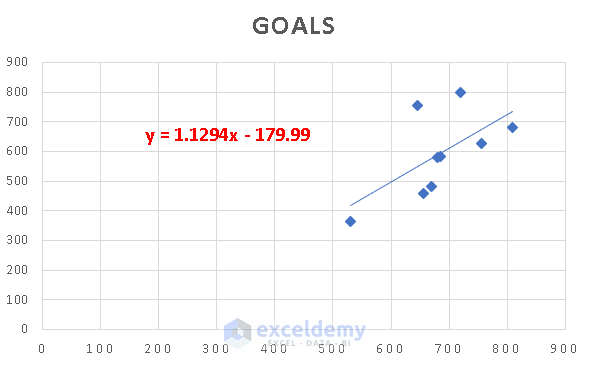
- Right-click on the scattered point and choose Add Trendline.
- From the Format Trendline box, check Linear and Display Equation on chart.
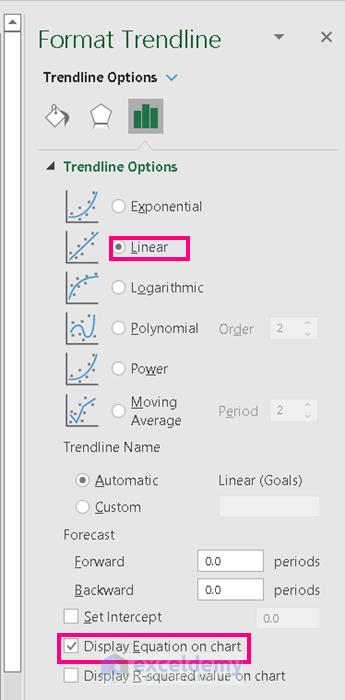
It will output the Regression Line along with the equation.
Method 3 – Formulas to Do Linear Regression
We can also employ Formulas to have Linear Regression. We will apply the INTERCEPT and SLOPE functions to find out the unknown.
Steps:
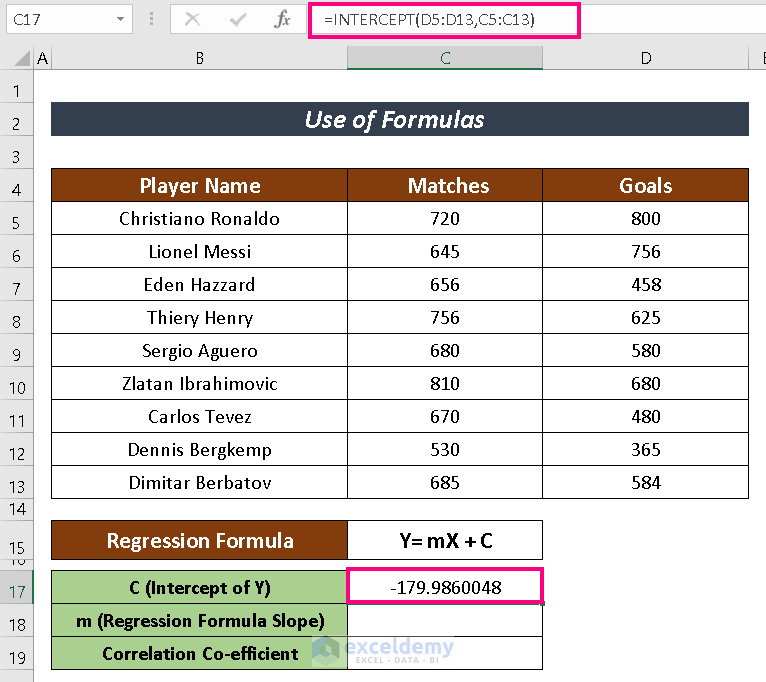
- Input the following formula in a selected cell to have the value of C which represents the intercepted value of Y-axis.
=INTERCEPT(D5:D13,C5:C13)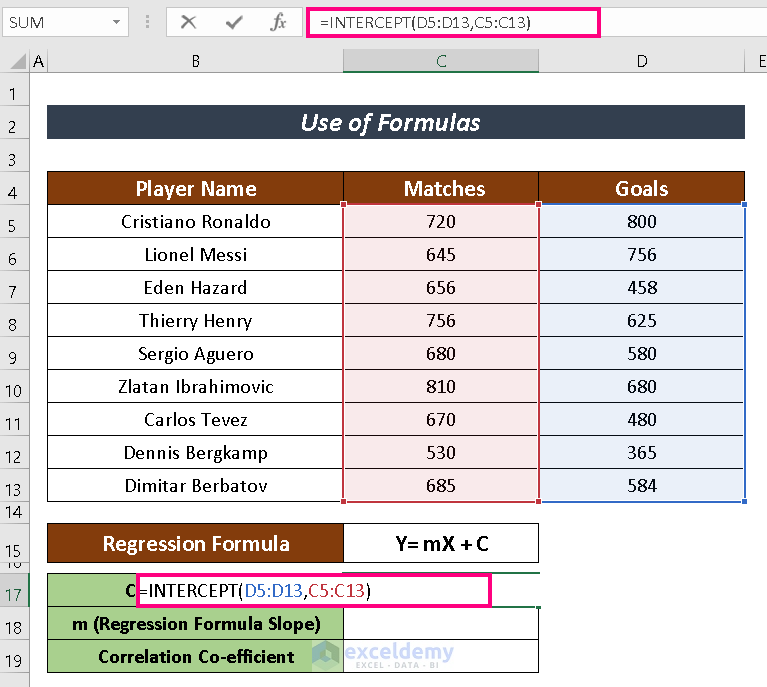
- Press ENTER to display the result.
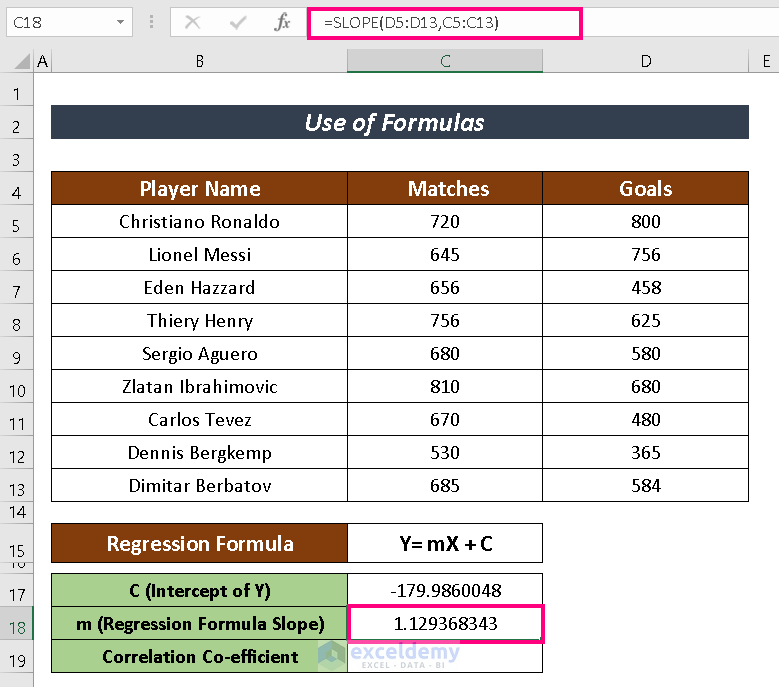
- Enter the following formula in a selected cell to obtain the value of the slope m.
=SLOPE(D5:D13,C5:C13)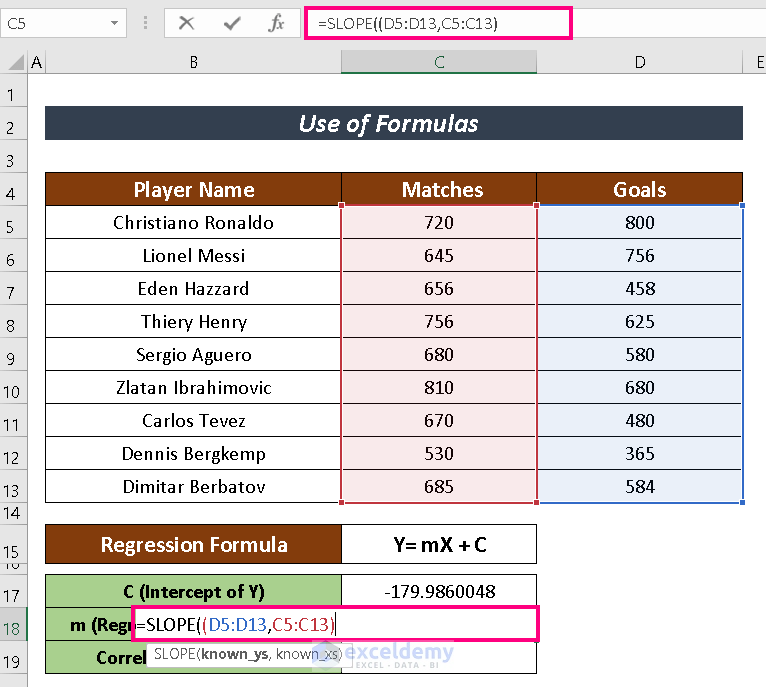
- Press ENTER.
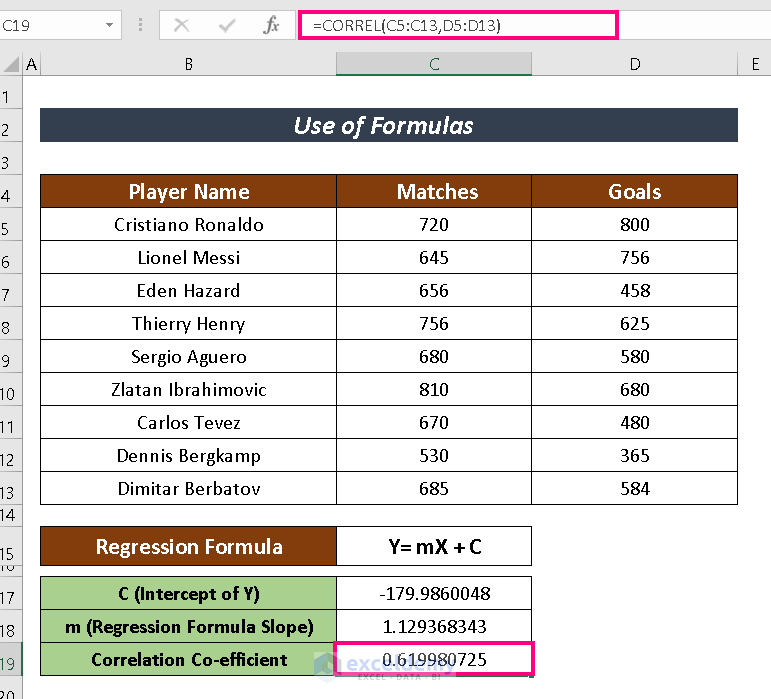
We are going to depict how strongly those two variables are connected with the CORREL function.
- Enter the following formula to have the CORREL function:
=CORREL(C5:C13,D5:D13)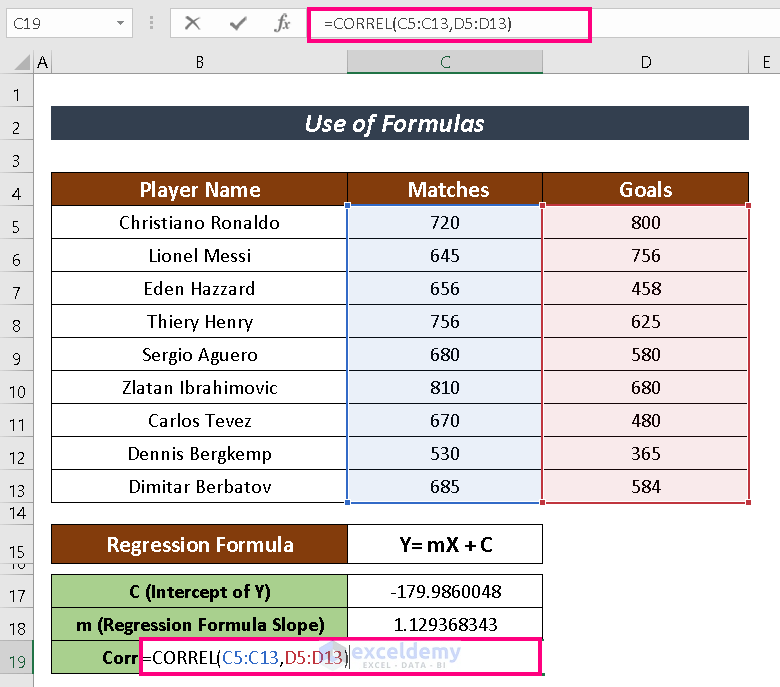
- Press ENTER.
Method 4 – Linear Regression with Solver Add-in
Using Solver Add-in to do Linear Regression is complex compared to the previous procedures. This method includes some pre-calculation approach before conducting Solver Add-in. The pre-calculation includes:
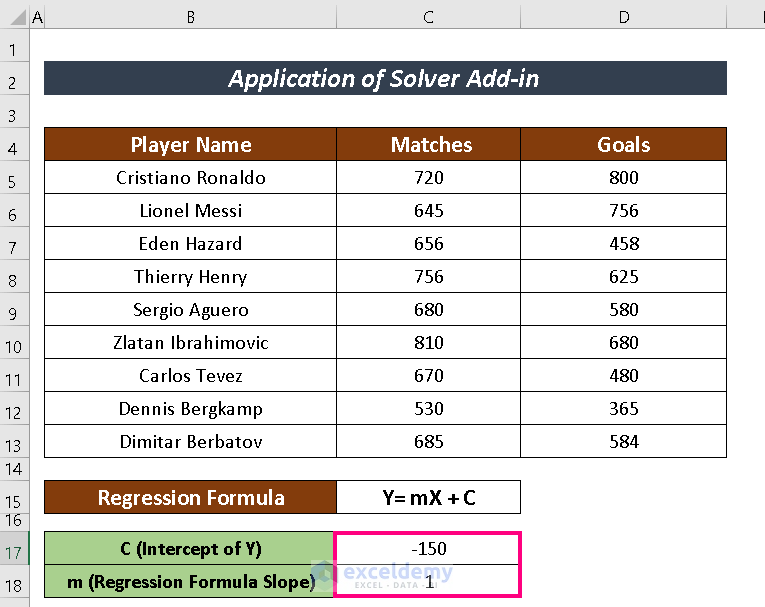
- Assumption of values for the slope (m) and intercept (C) components.
- Calculation of Ys using those assumed values.
- Error finding between the newly calculated Ys and Y
- Use the Solver Add-in to minimize the error.
Steps:
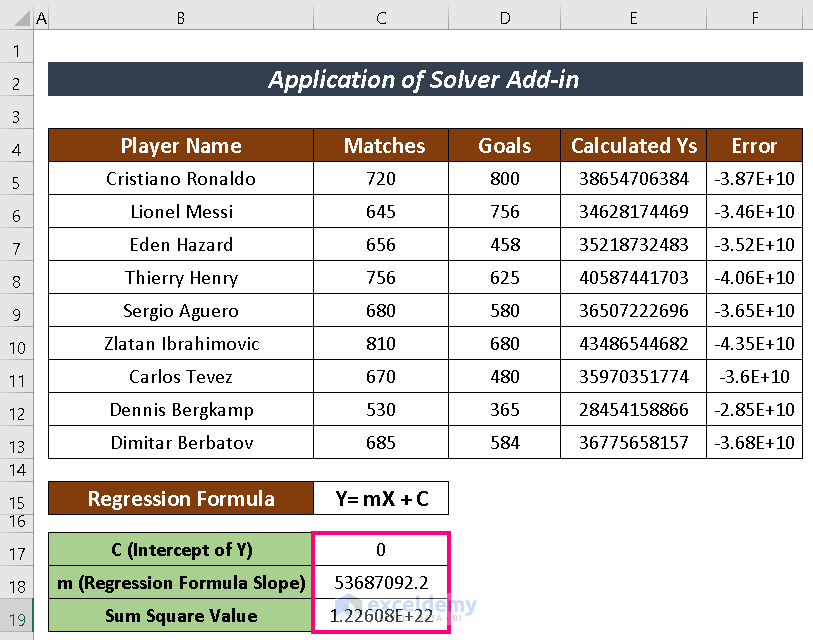
- Input the assumed value as Intercept of Y (e. -150) and Slope (i.e. 1).
- Calculate the value of Ys using the regression formula with the assumed value. The formula used here is:
=$C$18*C5 + $C$17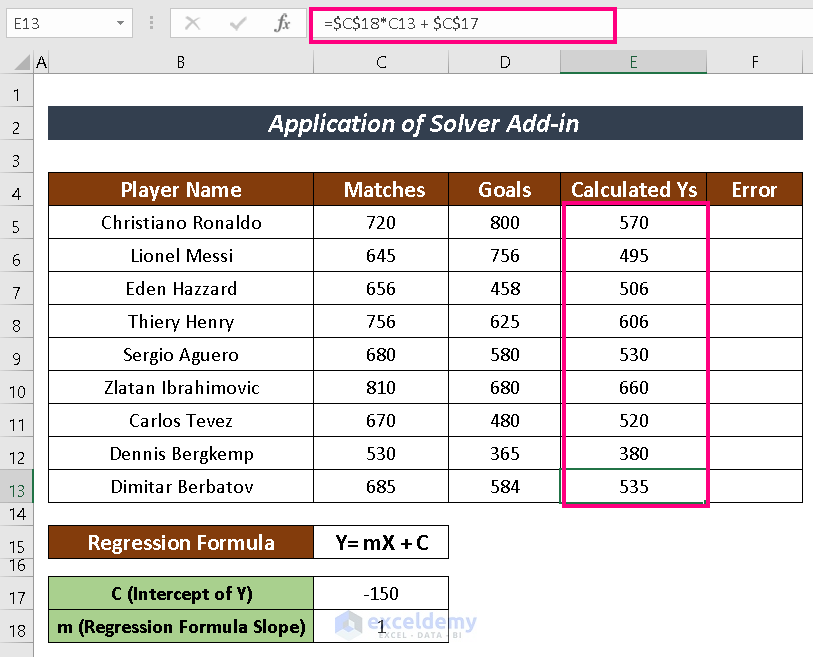
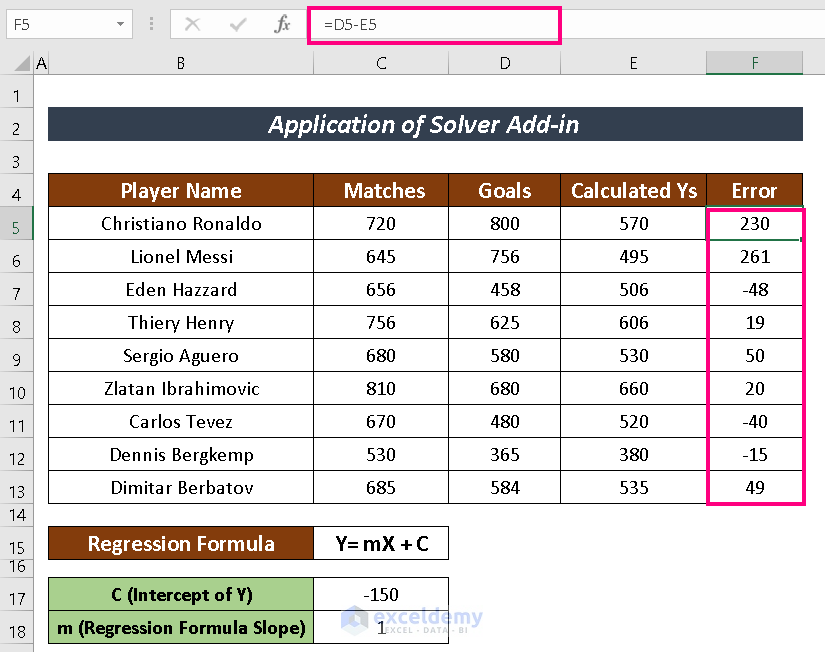
- Find the Error by subtracting the calculated Ys from the actual Ys.
- Find the Sum Square value using the SUMSQ function.
=SUMSQ(F5:F13)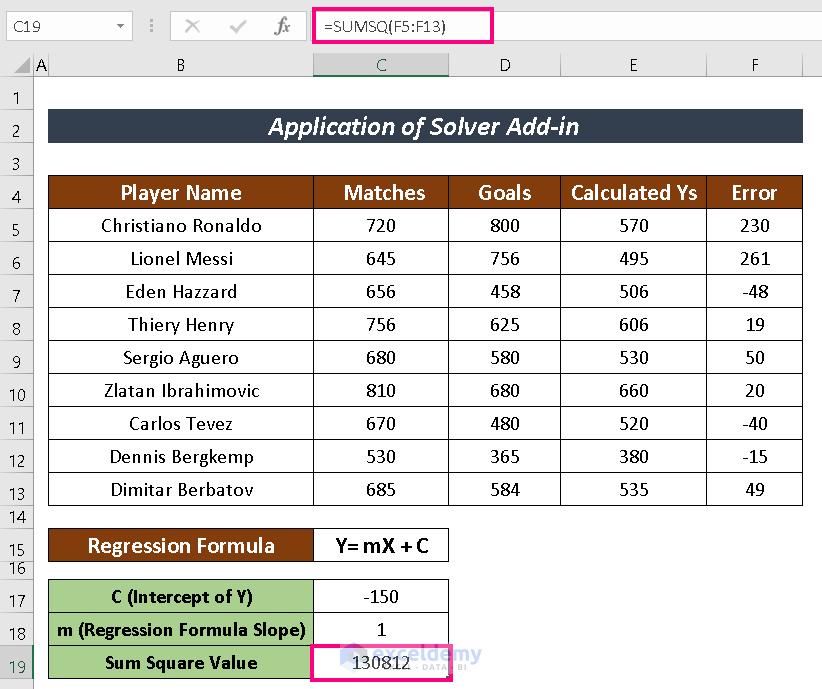
Open the Add-ins box using the above mentioned process and check the box Solver Add-in.
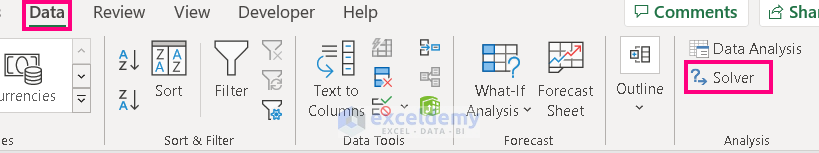
- Go to Data —> Solver.
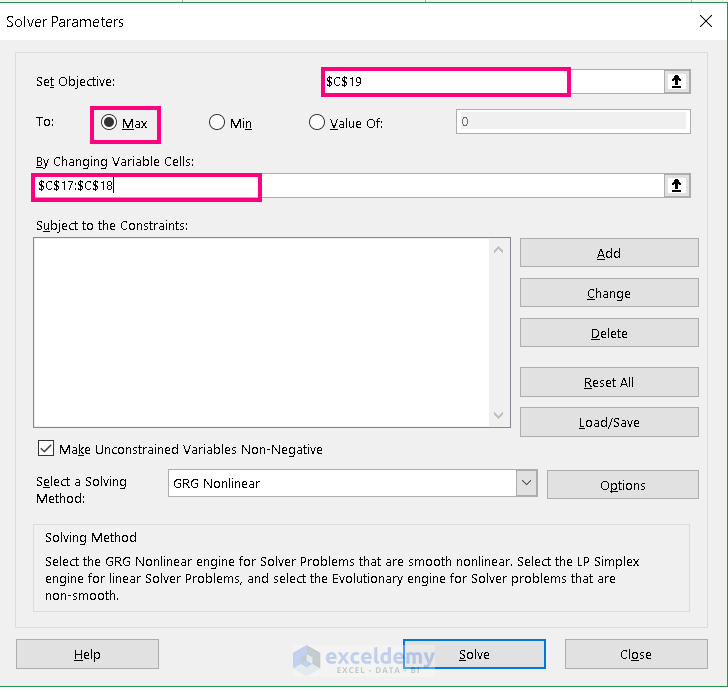
- From the Solver Parameters box, input Set Objective (i.e. C19).
- Check the box Max/Min/Value of depending on the dataset.
- Input Slope and Intercept cell numbers in the By Changing Variable Cells.
- Click on Solve.
- Check the Keep Solver Solution and click OK.
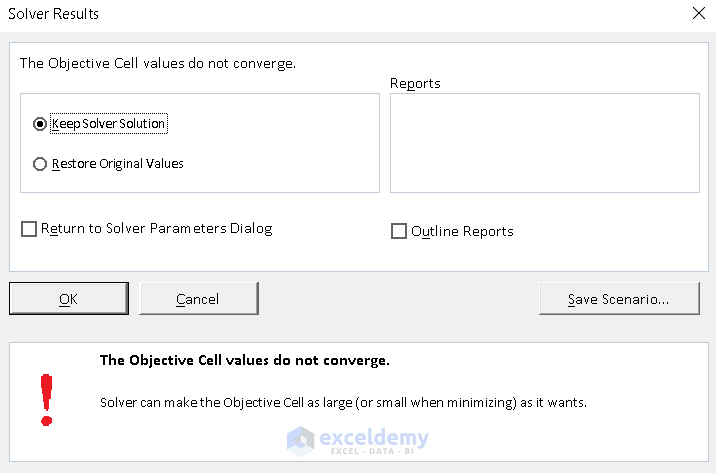
The outcome includes estimated Y with the Linear Regression Analysis.
Read More: How to Interpret Linear Regression Results in Excel
Download Practice Workbook
Related Articles
- How to Calculate P Value in Linear Regression in Excel
- How to Do Logistic Regression in Excel
- How to Interpret Regression Results in Excel
- How to Plot Least Squares Regression Line in Excel
- Multiple Linear Regression on Excel Data Sets
- How to Do Multiple Regression Analysis in Excel
- How to Interpret Multiple Regression Results in Excel
<< Go Back to Regression Analysis in Excel | Excel for Statistics | Learn Excel
Get FREE Advanced Excel Exercises with Solutions!
