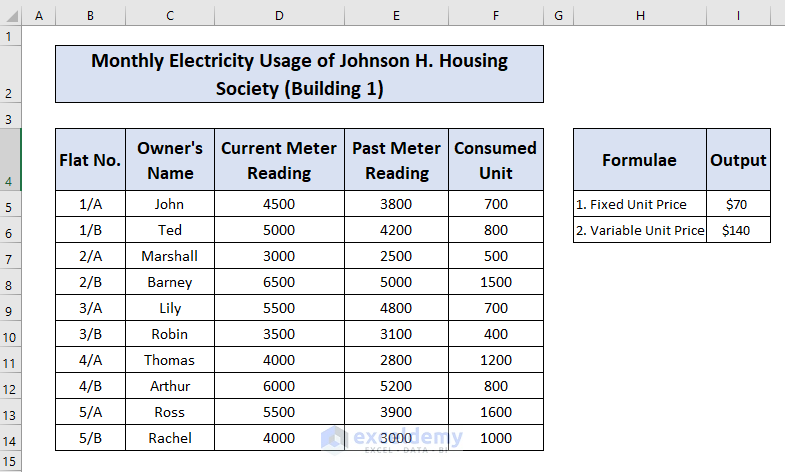
Latest Blog Posts

How to Calculate Variance and Standard Deviation in Excel

Basics of Variance and Standard Deviation Variance examines how distinct numerical values relate to one another within a data collection. It ...

How to Use IF Function with OR and AND Statement in Excel

Download Practice Workbook IF Function with OR & AND Statements.xlsx Example 1 - Utilize IF Function with OR and AND Statement in ...

How to Use VBA Large Function in Excel (4 Suitable Examples)

Excel functions can also be used in the VBA Macro. Many functions are available in the WorksheetFunction module. In this article, we will show you ...

Nested IF and ISERROR Formula in Excel (2 Practical Examples)

Microsoft Excel is a practical application. With Excel's tools and capabilities, you can perform an endless number of operations on a dataset. ...

How to Do Polynomial Interpolation in Excel (With Easy Steps)

What Is Interpolation? Interpolation means predicting a value between two specific given data points using the dataset. Data can be linear or ...

How to Use Multiple IF Statements in Excel Data Validation (3 Examples)

What Are Multiple IF Statements in Excel? In Excel, when a formula contains more than one IF statement nested within another IF statement, it ...

Use ISNUMBER Function with IF and Then Statements in Excel

We will use the following dataset to demonstrate how to use the ISNUMBER function for IF statements. Example 1 - Check If a Cell Starts ...

How to Display Labels Outside Doughnut Chart in Excel: 2 Methods

Method 1 - Creating Combo of Pie and Doughnut Charts Steps: Select the entire data range >> navigate to the Insert tab >> Insert ...

How to Insert Proportional Area Chart in Excel (4 Easy Steps)

Charts are useful tools that can be used for representing data in an Excel worksheet. We can also use Area Charts to display the data charts in a ...

How to Create a Bar Chart with Error Bars in Excel (4 Easy Methods)

The dataset below contains measurements of the Air Quality Index of Kyiv, the capital of Ukraine. To create a bar chart, select the AQI column ...

How to Create Progress Doughnut Chart in Excel

In this article, we will demonstrate how to create a Progress Doughnut Chart to show the percentage of progression of a task in Excel. To ...

How to Use IF-THEN Statements with Text in Excel (7 Examples)

To demonstrate how to use IF-THEN statements with text in Excel, we will use the following dataset, which contains columns for Product, Color, and ...

How to Create a Payroll Process Flowchart in Excel – 6 Steps

In a Flowchart each element in the diagram has different shapes. For example, a Rectangle indicates the Start or End of a flowchart. Other shapes ...

How to Use IF Statement with Yes or No in Excel (3 Examples)

Using the IF function, it is possible to analyze text, values, and even errors. It extends beyond simply determining whether two things are equal and ...

How to Use the DPRODUCT Function in Excel – 6 Examples

This is an overview:   The DPRODUCT Function in Excel Syntax: =DPRODUCT(database,field,criteria) Arguments: ...

Close the CTA

Advanced Excel Exercises with Solutions PDF


ExcelDemy
Logo