Which type of stock we should invest in and how the performance of the stocks would be, have been some burning questions for millennia. Investors will look to increase their profit by minimizing the risk. For that purpose, realized volatility value can be a good indicator. In this article, we will demonstrate how you can calculate the realized volatility in Excel in a step-by-step procedure.
What Is Realized Volatility?
Realized Volatility measures the range of profits for an investment scheme by examining its prior returns over a specified time frame. Variability and volatility in the entity’s stock prices can be used to gauge the amount of uncertainty and/or possible economic loss/gain from financing in a corporation. The most frequent statistical measurement is the standard deviation’s variability or the variation in returns from the mean. It serves as a gauge for the true price risk.
How to Calculate Realized Volatility in Excel: with Easy Steps
In 4 separate steps, we will describe how you can calculate the realized volatility in Excel with detailed explanations. These steps involve collecting information to formula input. In order to avoid compatibility issues, use Microsoft 365 edition.
Step 1: Gather Stock Data from Online Source
Before we delve into calculating the realized volatility of the stock prices, we have to collect the data first.
- In this regard, we opted for Yahoo finance, one of the most reliable and easily accessible sources of the stock price over the year. We went to the Yahoo finance site and downloaded the stock price of Apple.Inc in the year 2022.
- The data is present in the Excel sheet in the below image.
- We have the Date, the opening price, the top price, the down price, and the closing price of the stocks in the same year. We also got the adjusted price of the stocks alongside how much transaction or volume of stocks traded with it.

Read More: How to Calculate Implied Volatility in Excel
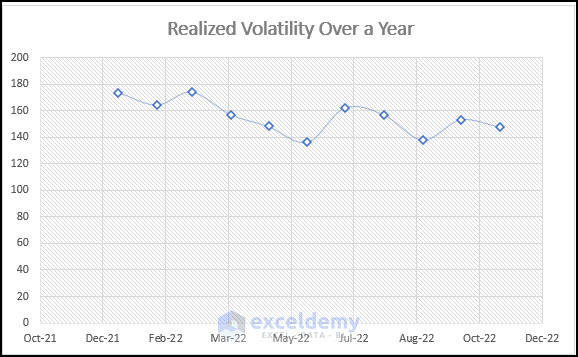
Step 2: Create Scatter Chart
As we have the required information, we can now create a chart from this information.
- For this, select the range of cell B4:B17 and the range of cell G4:G17.
- Then go to Insert > Scatter > Scatter with smooth lines and marker.

- Immediately you will notice that a scatter plot is now created with the range of data selected by you.
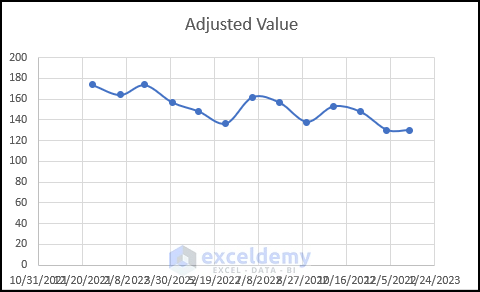
- After some adjustments like giving a new chart title, removing the axis title, and selecting a checkered plot area, the plot somewhat looks like the below image.
Step 3: Calculate Deviation and Variance
We plotted the adjusted value of the stock, but that’s not our primary goal. To calculate the realized volatility, we need to calculate the deviation and variance. We can use the LOG function to get the deviation value.
- Select cell I6 and enter the following formula:
=LOG(G6)-LOG(G5)
- Press Enter.
- Doing this, you will find that the deviation of stock price compared to the previous day is presented in cell I6.
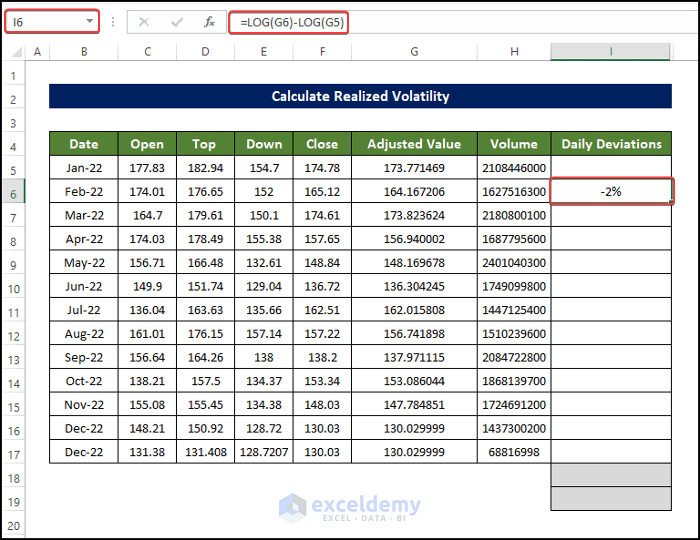
- Then drag the Fill Handle to cell I17.
- Thus, the range of cell I6:I17 is now with the deviation values.

- Now, select cell J6 and enter the following formula:
=I6^2
- Hit Enter.
- Then we can see the variance value in cell J6.

- Then drag the Fill Handle to cell J17.
- As a result, the range of cell I6:I17 is now with the variance values.

Read More: How to Calculate Daily Volatility in Excel
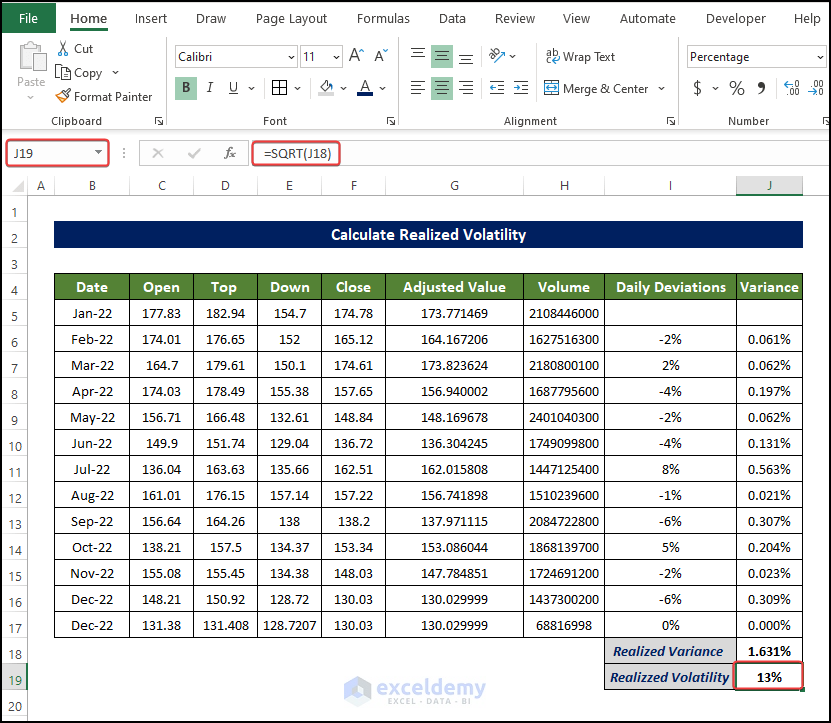
Step 4: Determine Realized Variance and Realized Volatility
As we have the variance and deviation values, we can now calculate the realized volatility and realized variance, using the SQRT and SUM functions respectively.
- Select cell J18 and enter the following formula:
=SUM(J6:J15)
- After pressing Enter, you will see the realized variance value.
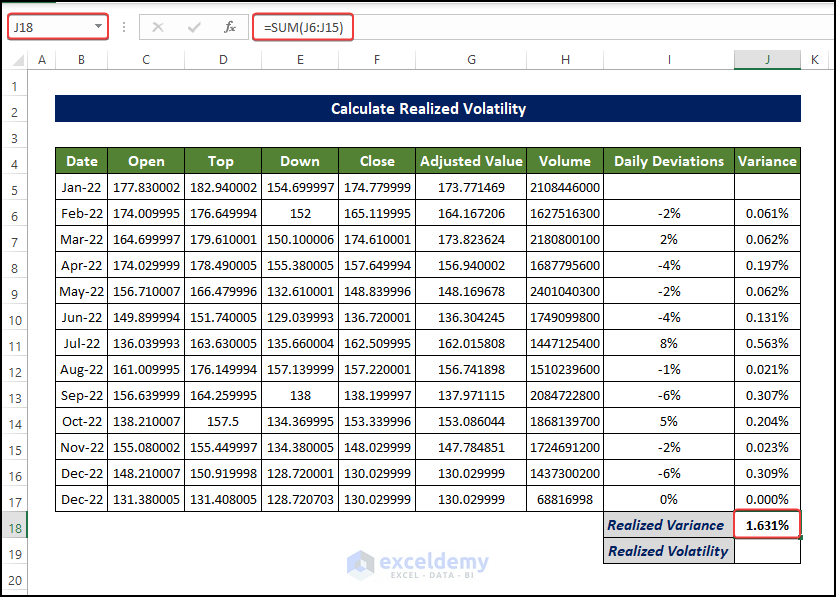
- Then select cell J19 and enter the following formula:
=SQRT(J18)
- After typing the formula, press Enter.
- Therefore, you will notice the realized volatility value in cell J19.
Advantages and Use of Realized Volatility
- It gauges the historical volatility of the actual asset performance. Based on its prior performance, it is useful to comprehend the durability of the asset.
- It shows the past price fluctuations of an asset as well as the time frame during which they occurred.
- The stock’s price risk is bigger the more volatile the market is. As a result, the stock has a bigger premium linked to it.
- To predict future volatility, or volatility of the asset, one might utilize the realized volatility of an asset. The premiums are depending on the fundamental volatility and have an impact on the prices of transactions involving complicated financial products, such as derivatives, options, etc.
- It serves as the basis for option pricing. Realized volatility is computed using statistical techniques and serves as a solid proxy for asset value volatility.
Limitation of Realized Volatility
- When calculating realized volatility, the results depend on the amount of data used. To statistically determine a reliable value of realized volatility, at least 20 observations are needed. Realized volatility is therefore a better tool for assessing longer-term (greater than a month) pricing risk in the market.
- Calculations of realized volatility lack direction. It takes both upward and downward price movement tendencies into account.
- When evaluating volatility, it is based on the premise that asset values reflect all available information.
Things to Remember
- The realized volatility assessment may limit downside price swings when determining the downside risk attached to a stock.
- A stock’s realized volatility declining over time is a sign that the stock is stabilizing.
- The stability of a stock can be assessed by comparing its volatility to the benchmark index; the lesser the volatility, the more predictable the asset’s price is.
Download Practice Workbook
Download the following Excel workbook that we’ve used to prepare this article.
Conclusion
Here, we presented how you can calculate the realized volatility in Excel in a step-by-step procedure. For this problem, a workbook is available to download where you can practice these methods. Feel free to ask any questions or feedback through the comment section.
Related Articles
- How to Calculate Annualized Volatility in Excel
- How to Generate Volatility Surface in Excel
- How to Calculate Volatility for Black Scholes in Excel
- How to Calculate Historical Volatility in Excel
<< Go Back to Volatility In Excel | Excel for Finance | Learn Excel
Get FREE Advanced Excel Exercises with Solutions!
