Volatility is the speed and magnitude of the fluctuations of the price of a specific time period. The price of an asset or a commodity might change every day and so does the Daily Volatility. Excel can help a lot to calculate Daily Volatility to keep up with the changes. In this article, we will walk you through 2 easy ways to calculate Daily Volatility in Excel.
How to Calculate Daily Volatility in Excel: 2 Easy Ways
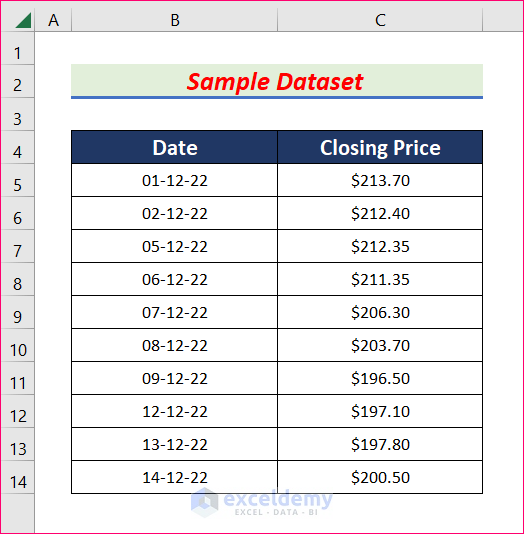
In this article, we will demonstrate two suitable methods to calculate daily volatility in Excel. We will use the following dataset for this purpose. The dataset contains the Closing Price of a commodity for each day from December 1, 2022, to December 14, 2022.
1. Apply Mathematical Formula to Calculate Daily Volatility
In this method, we will use a simple mathematical formula to calculate volatility in Excel. Read the following steps to learn how to do it.
Steps:
- First of all, insert a column named Daily Return.
- Then type the following formula in cell D6 to get the daily return for the closing price.
=C6/C5-1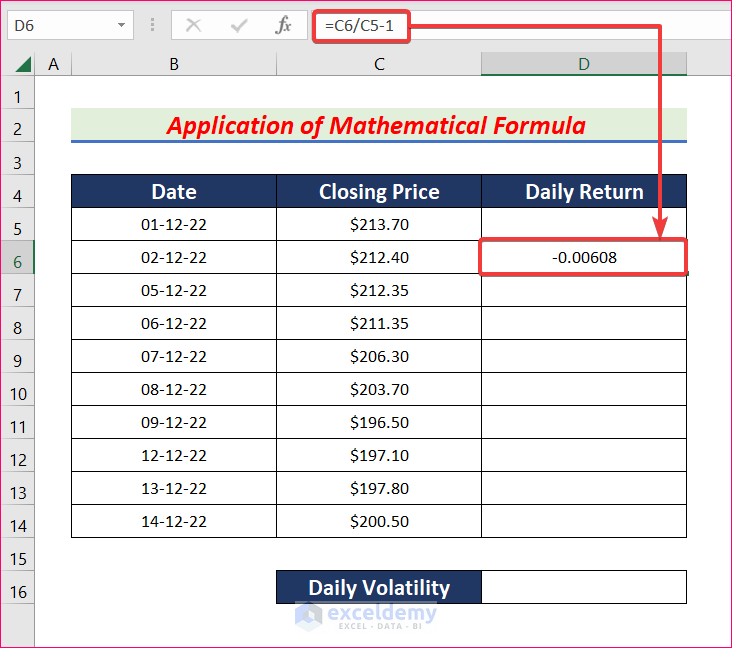
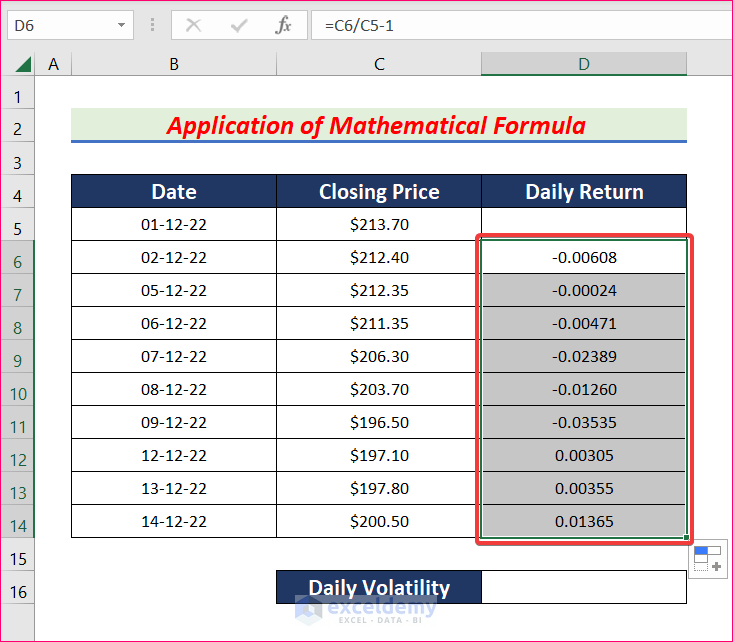
- Next, AutoFill the formula to the rest of the cells in column D to find the daily return for each date.
- After that, select cells D6 to D14. Then from the Home tab, go to,
Home → Number → Percent Style(%)

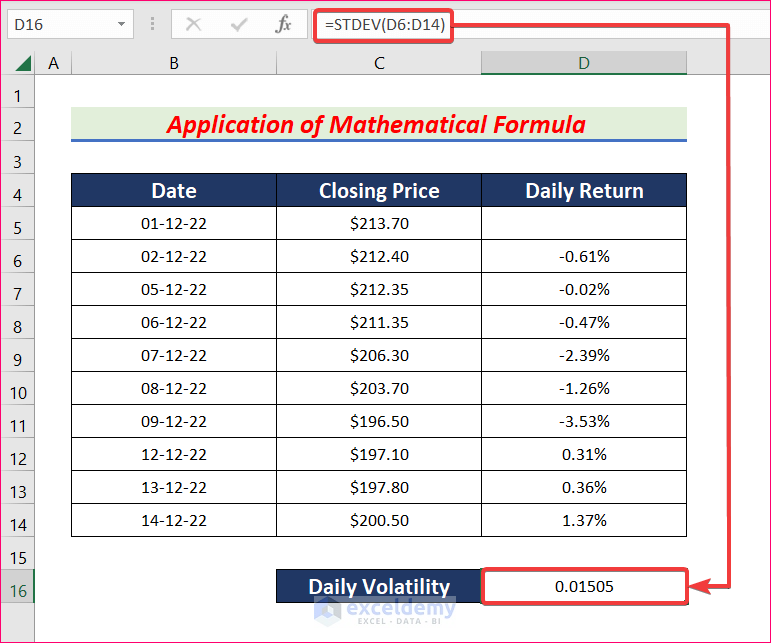
- As a result, you will get the daily return values in percentage.

- Now select cell D16 and write down the following formula. After that, hit Enter.
=STDEV(D6:D14)- Hence, you will get the Daily Volatility in decimal.
- To convert the Daily Volatility to percentage, click on Percent Style(%).
- Finally, you will get your desired Daily Volatility.

Read More: How to Calculate Annualized Volatility in Excel
2. Use LN Function to Calculate Daily Volatility in Excel
We will now use the LN function to calculate daily volatility in Excel. Follow the steps described in the following section.
Steps:
- First, select cell D6 and write down the following formula to determine the daily return for December 2, 2022.
=LN(C6/C5)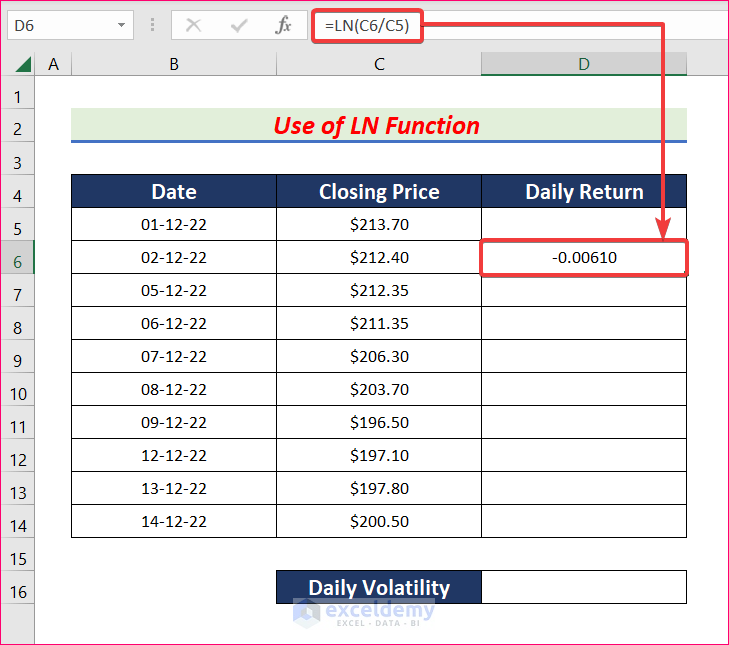
- After that, AutoFill the function to the rest of the cells in column D.
- As a result, you will get all the daily return values in decimal format.

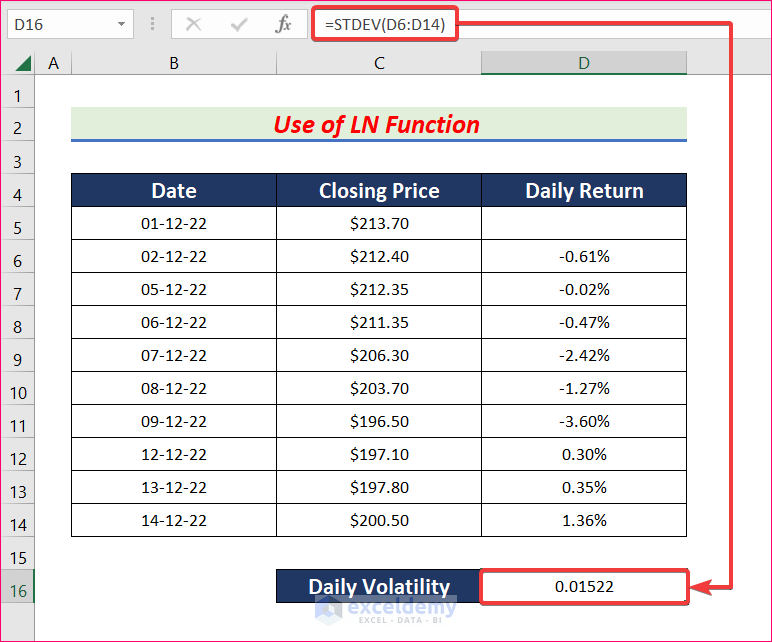
- To convert the values in percentages, select all daily return values and go to,
Home → Number → Percent Style(%)

- All the daily return data will turn into percentages.

- Next, select cell D16 and type the formula given below.
=STDEV(D6:D14)- This formula will give you the Daily Volatility in decimal format.
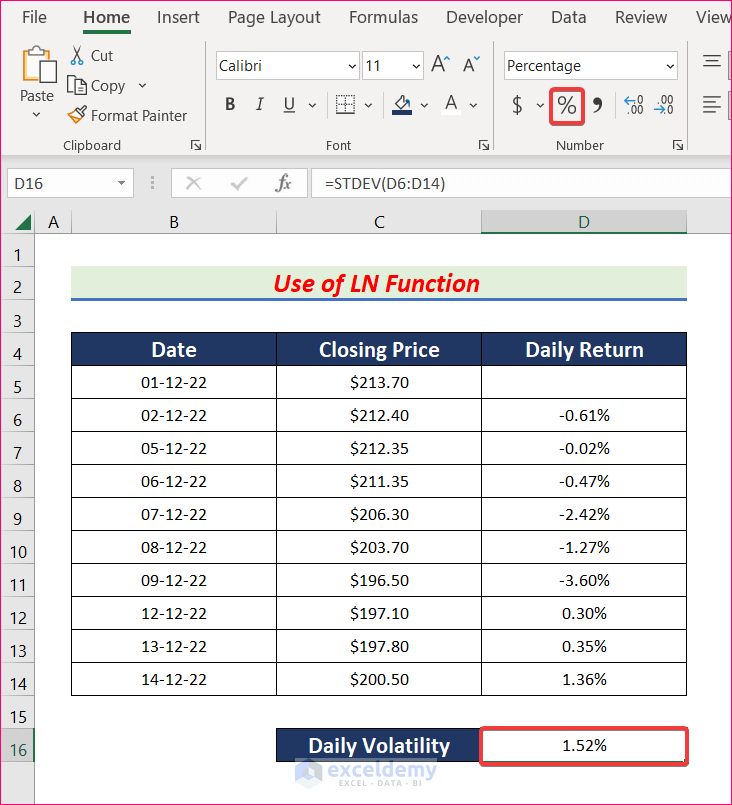
- Finally, change the Daily Volatility value in percentage by clicking on Percent Style (%).
- Don’t forget to give proper cell references or you won’t get the desired result.
- The first method gives more accurate results than the second one.
Read More: How to Calculate Historical Volatility in Excel
Download Practice Workbook
Download this practice workbook to exercise while you are reading this article.
Conclusion
Thanks for making it this far. I hope you find this article useful. Now you know two easy ways to calculate Daily Volatility in Excel. Please let us know if you have any further queries, and feel free to give us any recommendations in the comment section below.
Related Articles
- How to Generate Volatility Surface in Excel
- How to Calculate Volatility for Black Scholes in Excel
- How to Calculate Implied Volatility in Excel
- How to Calculate Realized Volatility in Excel
<< Go Back to Volatility In Excel | Excel for Finance | Learn Excel
Get FREE Advanced Excel Exercises with Solutions!
