Watch the Video – Create a Formula in Excel to Calculate Percentage
Method 1 – Calculate the Percentage Formula to Compare Values
We have a dataset describing the quantities of some products bought and sold. We want to compare the products based on the percentage of sales. We need to calculate the percentage of the quantity bought and sold.
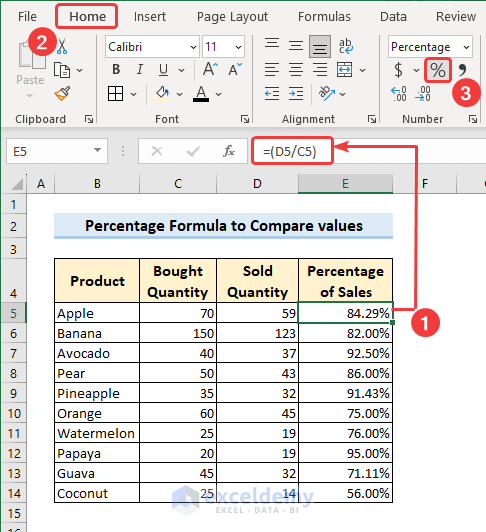
- Enter the following formula in cell E5.
=D5/C5Here, dividing the sold quantity (D5) by the bought quantity (C5) will get you the fraction of sales, and converting the cell format to percentage from the Home tab will show you the percentage.
- Drag the Fill Handle tool to calculate the percentage for other cells.
- After you calculate the percentage for each item, you can compare the products.
For our dataset, the percentage of sales is maximum for Papaya (95.00%) and minimum for Coconut (56.00%).
Read More: How to Apply Percentage Formula in Excel for Marksheet
Method 2 – Formula to Calculate Percentage from Total Number
Let’s consider the ‘bought quantity’ of products from our previous dataset. We want to find out the percentage of the quantity of each product bought from the total bought quantity.
We have used the SUM function to calculate the total quantities of the products. Then, we created the following formula in Excel to calculate the percentage:
=C5/SUM($C$5:$C$14)For range $C$5:$C$14, we have used the absolute reference to lock the range so that it does not change when dragging or copying the formula for other cells.
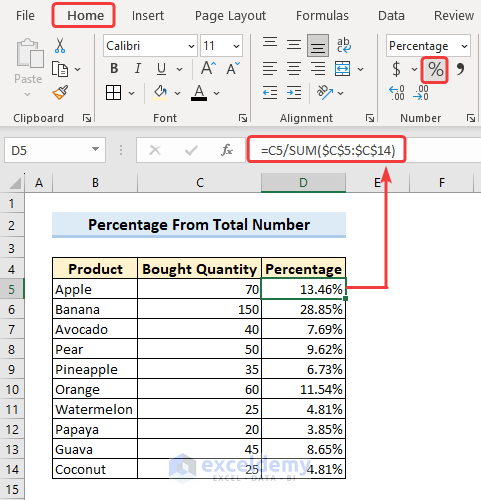
This formula calculates the percentage of total values that apply to the same category (e.g., Bought Quantity).
Read More: How to Calculate Percentage of a Number in Excel
Method 3 – Percentage Formula Based on Condition
3.1. Calculate Percentage Based on Single Criterion
In the dataset below, we can see various products, but “Avocado” is repeated three times. Here, we want to calculate the percentage of sales for “Avocados” only. We have only one criterion, based on which we will create a formula to get the percentage.
- Enter “Avocado” in cell G5
- Enter the following formula:
=SUMIF(C5:C17,G4,D5:D17)/SUM(D5:D17)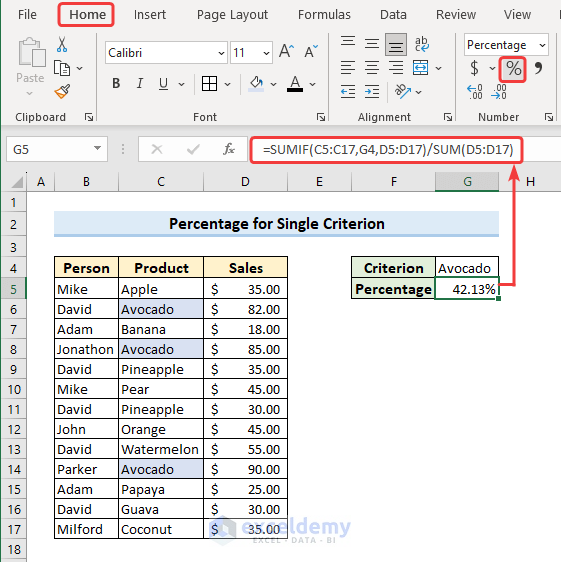
Formula Breakdown
The SUMIF function adds the cells specified by a given condition or criteria. So, it checks for the cell value of G4 in the range C5:C17 and sums the corresponding cell values in similar rows in the range D5:D17.
- SUMIF(C5:C17,G4,D5:D17) = 82+85+90 = 257
- SUM(D5:D17) = 610
- SUMIF(C5:C17,G4,D5:D17)/SUM(D5:D17) = 257/610 = 0.4213 = 42.13%
3.2. Calculate Percentage Based on Multiple Criteria
The dataset shows the product “Avocado” and the person “David” multiple times. However, we only want the percentage of “Avocados” sold by “David.” We have two criteria: “David” in cell G4 & “Avocado” in cell G5.
- Enter the following formula:
=SUMIFS(D5:D17,B5:B17,G4,C5:C17,G5)/SUM(D5:D17)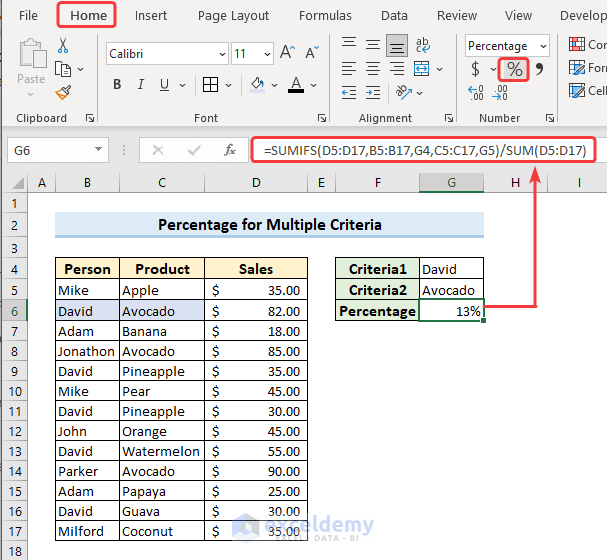
Formula Breakdown
The SUMIF function adds the cells specified by a given condition or criteria. So, it checks for the cell value of G4 in the range B5:B17 and finds the cell value of G5 in the range C5:C17. Later, it only sums the cell values that are common for the two criteria, G4 and G5.
- SUMIFS(D5:D17,B5:B17,G4,C5:C17,G5) = 82
- SUM(D5:D17) = 610
- SUMIFS(D5:D17,B5:B17,G4,C5:C17,G5)/SUM(D5:D17) = 82/610 = 13%
Read More: How to Calculate Percentages Based on Conditional Formatting
Method 4 – Calculate the Percentage Difference Between Numbers Using a Formula
4.1. Determine the Percentage Difference Between Different Columns
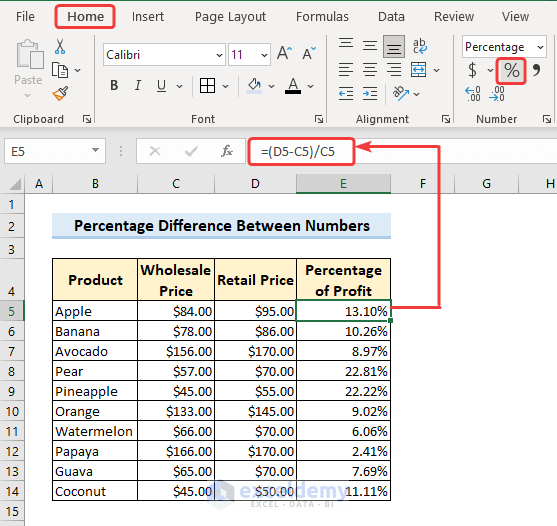
For some products, we have the Wholesale Price in one column and the Retail Price in another column, from which we want to calculate the percentage of profit. To do this, we need to subtract the Retail price from the Wholesale price and divide the difference by the Wholesale price.
- Enter the following formula:
=(D5-C5)/C5Here, D5 is the Retail price, and C5 is the Wholesale price.
4.2. Calculate in the Same Column to Find the Percentage Increase or Decrease and Predict the Percentage
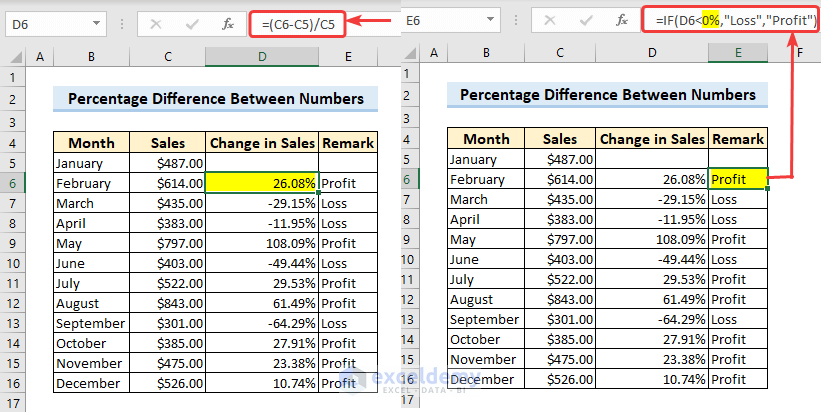
We have sales data over the year in a single column from which we will calculate the percentage difference. We will find the change in sales in a month compared with the previous month.
- Enter the following formula for the month of February:
=(C6-C5)/C5- Enter the formula for the other cells:
=IF(D6<0%,"Loss","Profit")You can see that for some months, the result is positive, and for some months, it’s negative. The positive value indicates Profit, and the negative value indicates Loss. If we want to comment on the change (whether Profit or Loss), we will create a formula with the IF function. For change <0%, we will comment Loss, and for >0%, we will comment Profit.
This method is good to use when you need to find the percentage difference in the same column and comment on the difference.
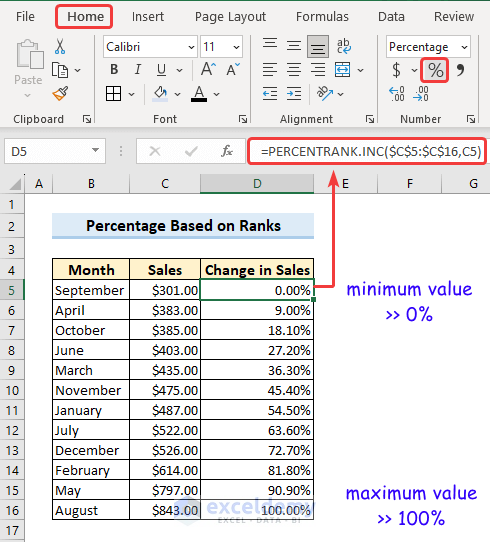
Method 5 – Use PECENTRANK.INC Function to Calculate Percentage Based on Rank
Steps:
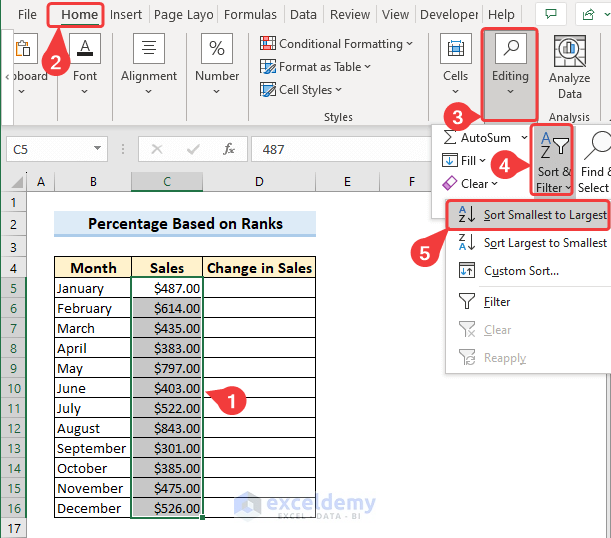
- Select the range of data with values >> go to the Home tab >> click the dropdown of Sort & Filter under the Editing group.
- Select Sort Smallest to Largest from the dropdown menu.
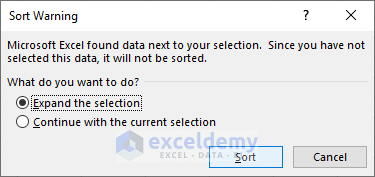
- The Sort Waring box will pop up.
- Check expand the selection.
- Click Sort.
- The data is sorted.
- For the minimum value in the range, enter the following formula:
=PERCENTRANK.INC($C$5:$C$16,C5)This will show you 0% for the minimum value.
- Enter the formula, and the percentage will keep increasing with the increase in the value.
- For the maximum value, it will show 100%.
Method 6 – Apply the AVERAGE Function to Calculate the Average Percentages
We have a dataset that represents the sales growth percentages of a company over a period of five years.
To calculate the average sales growth percentage over these five years using the AVERAGE function, enter the following formula:
=AVERAGE(C5:C9)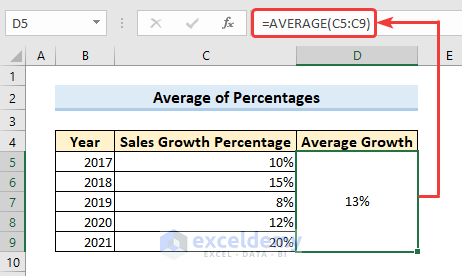
Read More: How to Calculate Average Percentages in Excel
Several Examples of Using Percentages in Excel Formula
1. Calculate Total Amount from Percentage
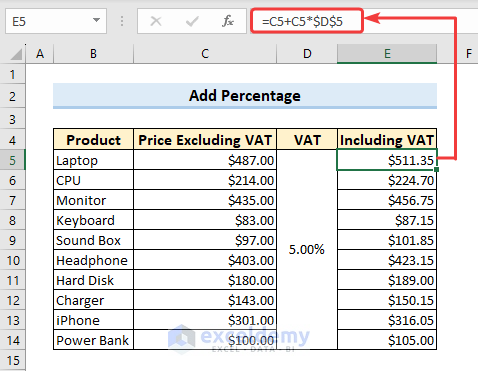
Case 1: Formula to Add a Percentage
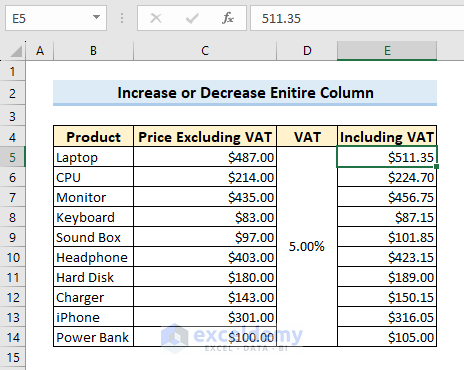
A shop is selling some products, and 5.00% VAT applies to the selling price of all types of products. The final price, including VAT, is 5.00% more than the original price, excluding VAT.
To get the final price, we must create a formula that adds a percentage to the previous price. The formula is below:
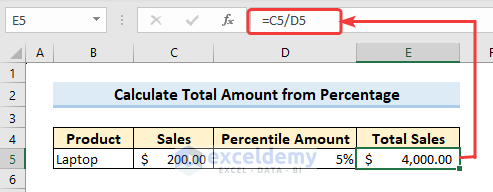
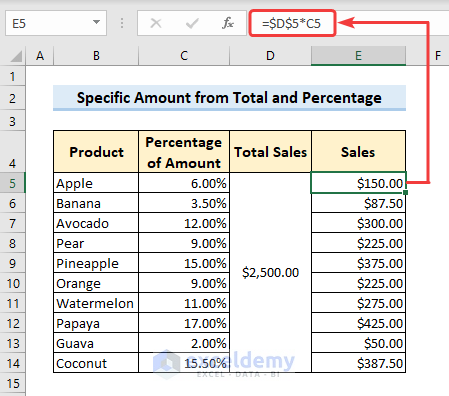
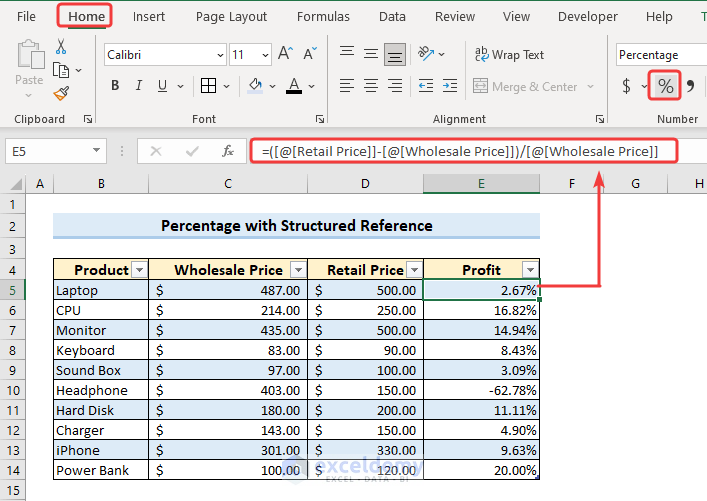
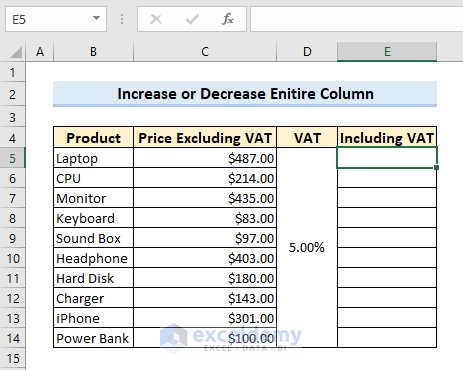
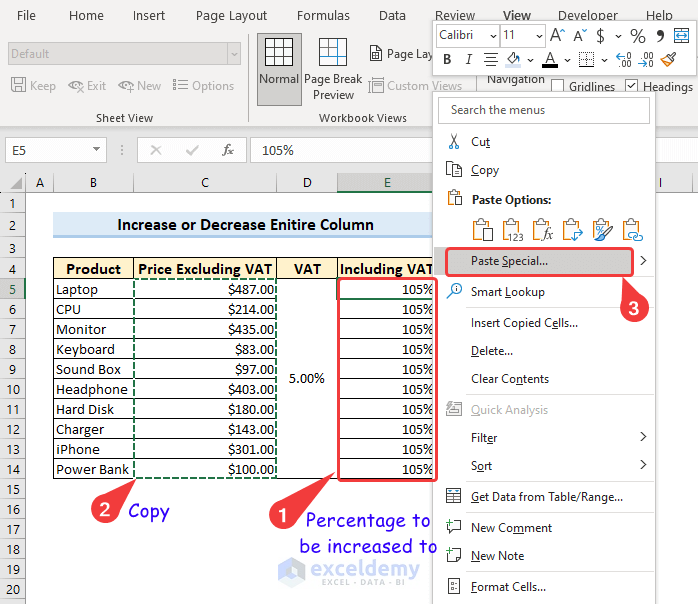
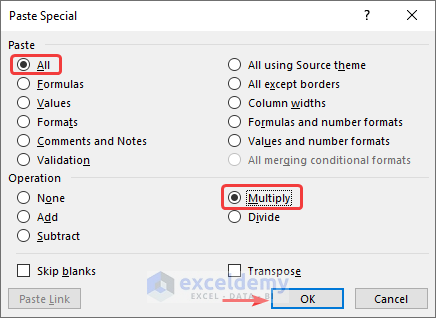
This formula calculates the VAT using C5*$D$5 for this portion and adds the VAT to the original price C5 to get the final price, including VAT. Read More: How to Add 15 Percent to a Price in Excel A shop has sold some laptops, and the price of one laptop ($200) is 5% of the total amount. So, we have the partial amount and percentile amount. We need to find the total sales from this data. If we want to calculate the total amount from this percentile amount, we can use the formula below. Here, dividing the partial amount by the percentile amount will get you the total amount. Read More: How to Calculate Total Percentage in Excel To determine a specific amount from the percentage and total amount, we can use the list of products below. The dataset describes the total sales from these products and the percentage of sales for each product. To determine the specific amount from each product, we can multiply the total sales by the percentage amount of the specific product. This will find you the sales from a specific product. Read More: How to Use Excel Formula to Calculate Percentage of Grand Total Our dataset has Wholesale and Retail prices of some products, from which we will calculate the Percentage of Profit. To do this, we need to subtract the wholesale price from the retail price and then divide the difference by the wholesale price. In the dataset below, we have the price of some products and a 5% VAT. To get the price, including VAT, we need to increase the entire column by 5%. As a result, your values will increase by 105%. Read More: How to Add Percentage to Price with Excel Formula You can download the practice book from the link below.=C5+C5*$D$5
Case 2: Total Amount from Percentile Amount
=C5/D5
2. Determine Specific Amounts from Percentage and Total Amount
=$D$5*C5
How to Create a Formula with Structured References to Calculate Percentages
=([@[Retail Price]]-[@[Wholesale Price]])/[@[Wholesale Price]]
How to Increase or Decrease an Entire Column by a Percentage Without a Formula
Related Articles
Get FREE Advanced Excel Exercises with Solutions!

