In this tutorial, we will demonstrate 3 approaches to calculate the sales growth percentage in Excel.
Method 1 – Using the Basic Formula
The basic formula to calculate the sales growth rate is:
Sales Growth Rate =((Total Sales in this Period - Total Sales in the previous Period)/Total Sales in the Previous Period)*100
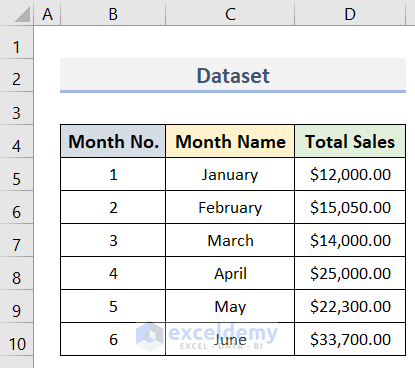
Let’s apply this formula on the dataset (B4:D10) below.
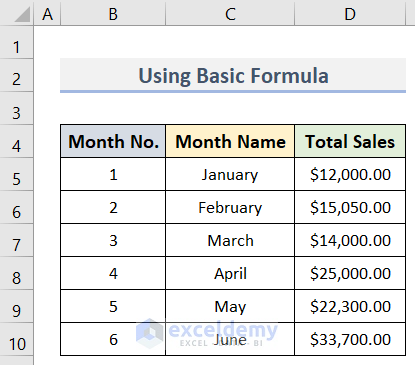
Steps:
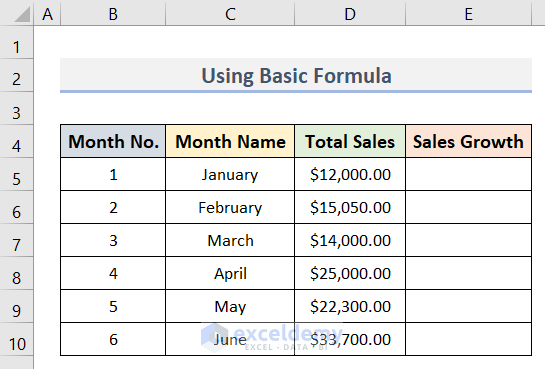
- Select a new column (E4:E10) to store the growth rate values.
- Enter ‘Sales Growth’ as the heading for the new column.
- Select the second cell (E6) in the new column (because we do not have any prior growth rate to compare against in the first cell).
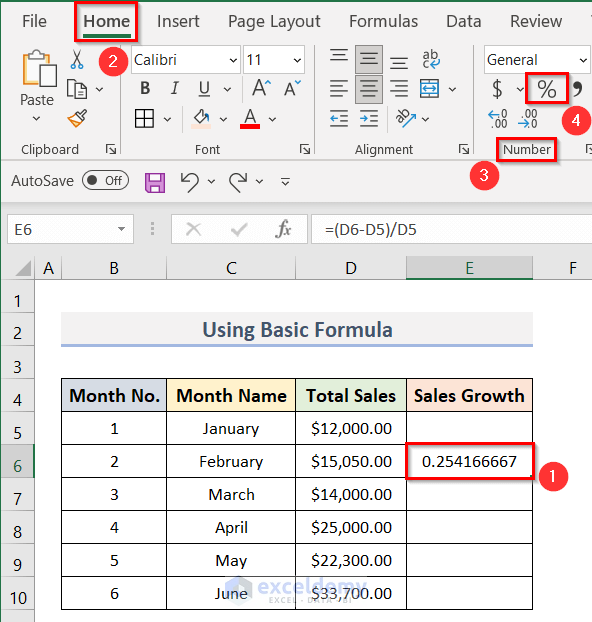
- To calculate the Sales Growth Percentage for February, enter the following growth rate formula in cell E6:
=(D6-D5)/D5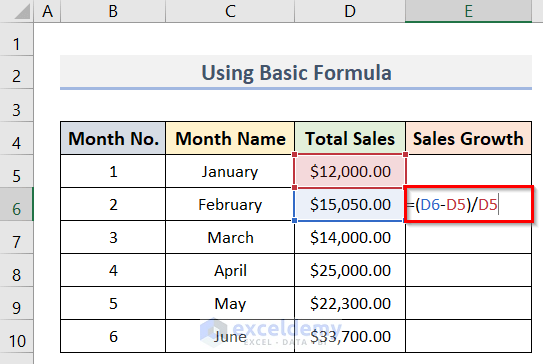
- Press Enter to return the result.
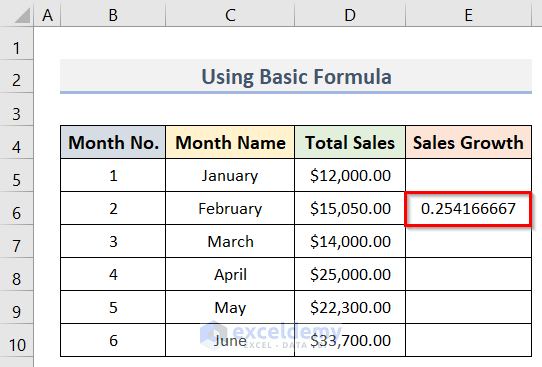
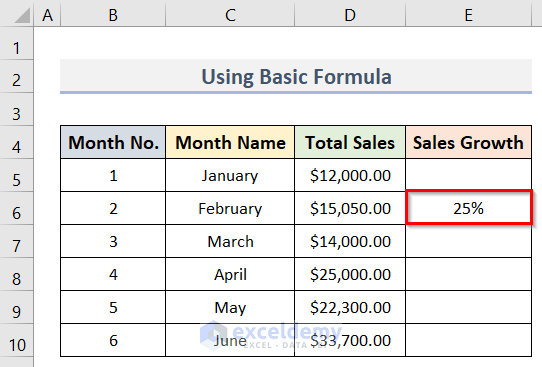
- To get the result in percentage format, select the cell that contains the result (E6).
- Go to the Home tab and from the Number group click on the % symbol.
We have our desired Sales Growth Percentage.
- Drag the Fill Handle (the small Plus (+) sign on the right-bottom corner of the cell) down through the rest of the column. Or, double-click on it.
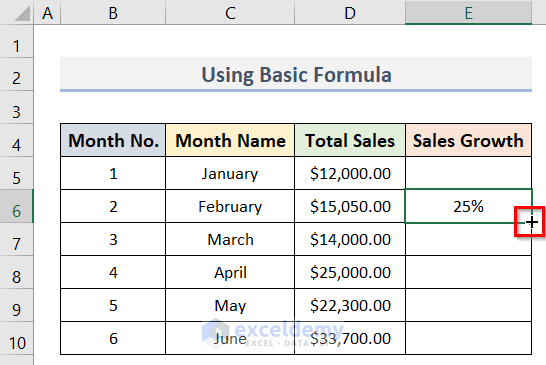
The other cells of the column will be automatically filled with the formula in ascending order of cell references (see screenshot).
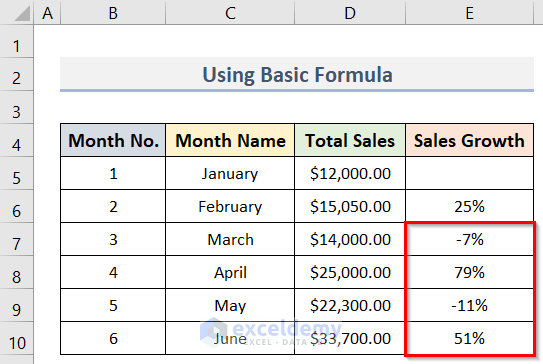
- For example, cell E9 has the formula:
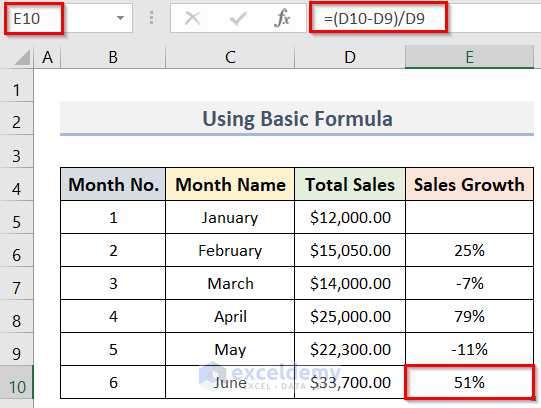
=(D9-D8)/D8- Similarly, the formula in cell E10 is:
=(D10-D9)/D9- And so on.
In this way, we get the Sales Growth Percentage at the end of each month.
Note:
Some versions of Excel may return the Sales Growth rates directly in the percentage format, saving the need to convert from decimal format as we have done here.
Read More: How to Calculate Growth Percentage with Formula in Excel
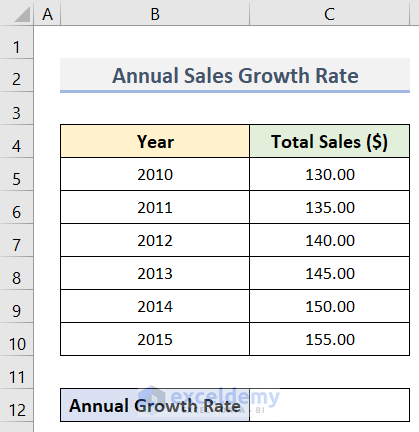
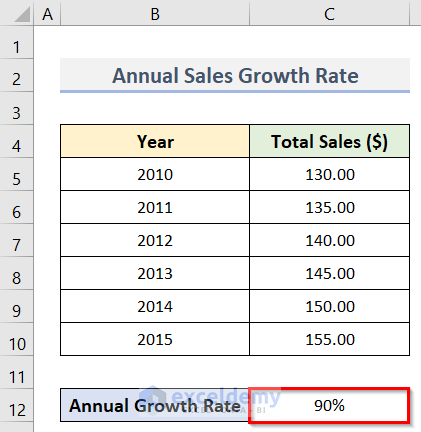
Method 2 – Determining Annual Sales Growth Rate
Suppose we have a dataset (B4:C10) containing some Years and the Total Sales in those years. Let’s determine the Annual Growth Rate of the Sales in cell C12.
Steps:
- In cell C12 enter the following formula:
=((C10-C5)^(1/5))-1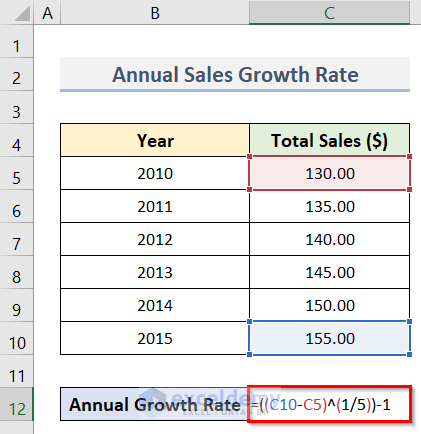
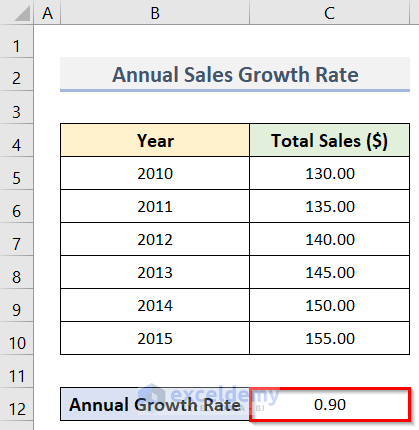
- Press Enter.
The result is in decimal format.
To get the result in percentage format:
- Select cell C12.
- Go to the Home tab.
- From the Number group, click on the % symbol.
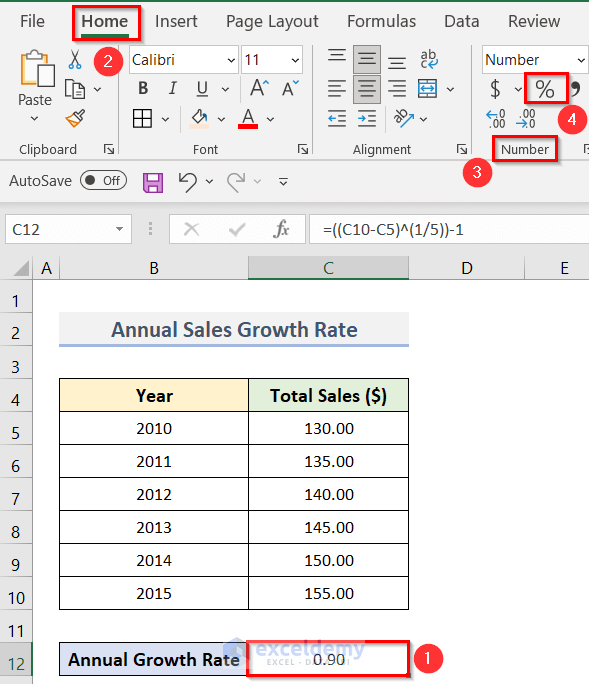
We have the desired result in percentage format.
Similarly, you can calculate the monthly growth rate in Excel.
Read More: How to Calculate Sales Growth over 3 Years in Excel
Method 3 – Using Excel GROWTH Function
Excel provides a built-in function called GROWTH which analyzes a set of given data and can predict output data.
The formula that the GROWTH function uses is:
Y=b*m^X
The GROWTH function takes four arguments:
- Known Y’s:
Applied to our dataset, the Month No’s are the independent variables and the Total Sales are the dependent variables or Known Y’s. The argument is an array of cells, and is mandatory for the function.
- Known X’s:
Applied to our dataset, the independent variables Month No’s are the Known X’s. The argument is also an array of cells, and is optional. If not specified, values of 1…2…3… up to the total number of Known Y’s will be assumed.
- New X’s:
New X’s are the independent variables for which we want to predict the Y’s. For instance, if we want to predict the estimated sales of July by analyzing the data from January to June, then the estimated sales of July will be the New X’s. This argument can be a single cell or an array.
- Constant:
The value of ‘b’ in the formula of the Growth function depends on this constant. The value can be either TRUE or FALSE. If it is TRUE, Excel calculates the value of b and then uses it. If FALSE, Excel sets the value to 1. When the parameter is missing, by default Excel assumes TRUE.
3.1 – Calculating Sales Growth
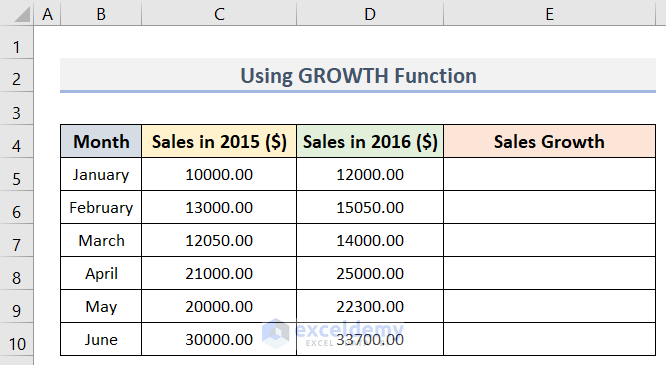
Suppose we have a dataset (B4:E10) that contains the Sales in 2015, the Sales in 2016 and their corresponding Months (from January to June). We will use the GROWTH function to find out the Growth of the Sales values in the E5:E10 range.
Steps:
- In cell E5, enter the formula below:
=GROWTH(D5:D10,C5:C10)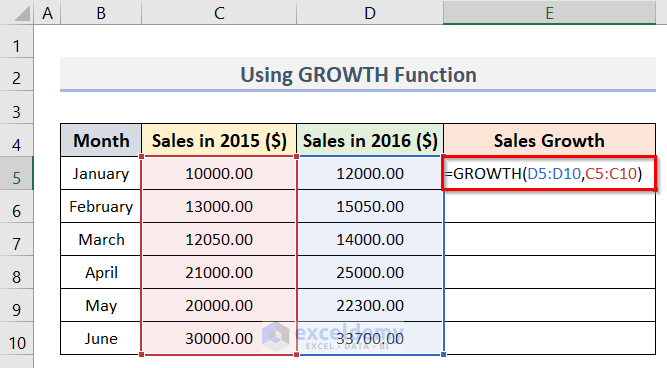
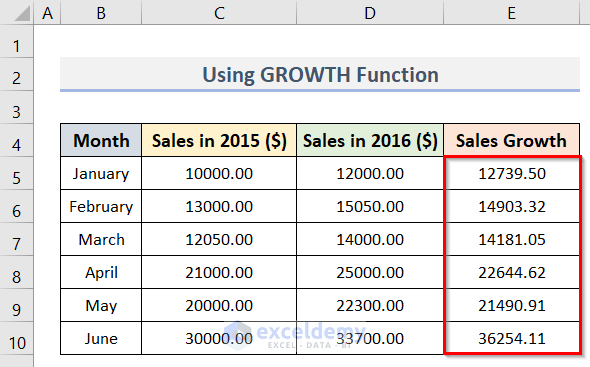
- Press Enter.
The Sales Growth values are returned in the range E5:E10.
Read More: Growth Over Last Year Formula in Excel
3.2 – Forecasting Output Based on Estimation
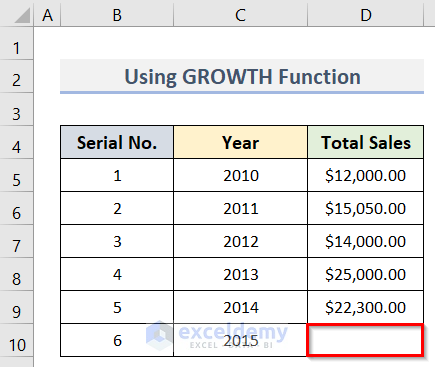
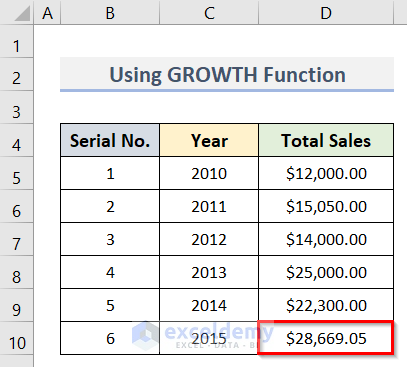
Suppose we have the dataset (B4:D10) below containing some Years, their Serial No. and the values of Total Sales in those years. The Total Sales value in the Year 2015 is missing.
Let’s forecast the Total Sales in 2015 by estimating the data from the Year 2010 to 2014 using the GROWTH function.
Steps:
- In cell D10, enter the following formula to predict the Total Sales in 2015:
=GROWTH(D5:D9,C5:C9,C10)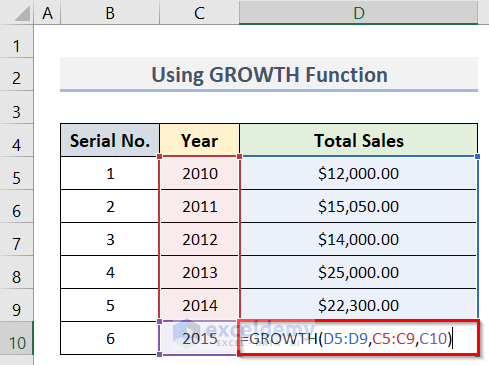
- Press Enter.
An estimate for the Total Sales in 2015 is returned.
Read More: How to Calculate Sales Growth over 5 Years in Excel
Things to Remember
When using the GROWTH function:
- The length of the known X’s array must be equal to that of the known Y’s.
- The known Y’s array has to be greater than or equal to 0.
- If all the known X’s, known Y’s or new X’s are not numeric values, Excel will return an Error.
Download Practice Workbook
Related Articles
- How to Calculate Dividend Growth Rate in Excel
- How to Use the Exponential Growth Formula in Excel
- Growth Formula in Excel with Negative Numbers
- How to Calculate Year over Year Growth with Formula in Excel
<< Go Back to Growth Formula In Excel | Excel Formulas for Finance | Excel for Finance | Learn Excel
Get FREE Advanced Excel Exercises with Solutions!
