Sales growth over various periods is one of the key performance indicators for most companies. In this article, we will demonstrate how to calculate the sales growth over 3 years in Excel.
Extract Annual Net Sales
Before we can calculate the sales growth over 3 years, let’s extract the Total Sales for the 3 years in question from a dataset of Sales information.
In the dataset below, we have some sales amounts against some dates over 3 years. We’ll group all the sales amounts for each corresponding year using a formula containing the SUMPRODUCT and YEAR functions. Then we’ll use these values to calculate the sales growth over the period they represent.
Steps:
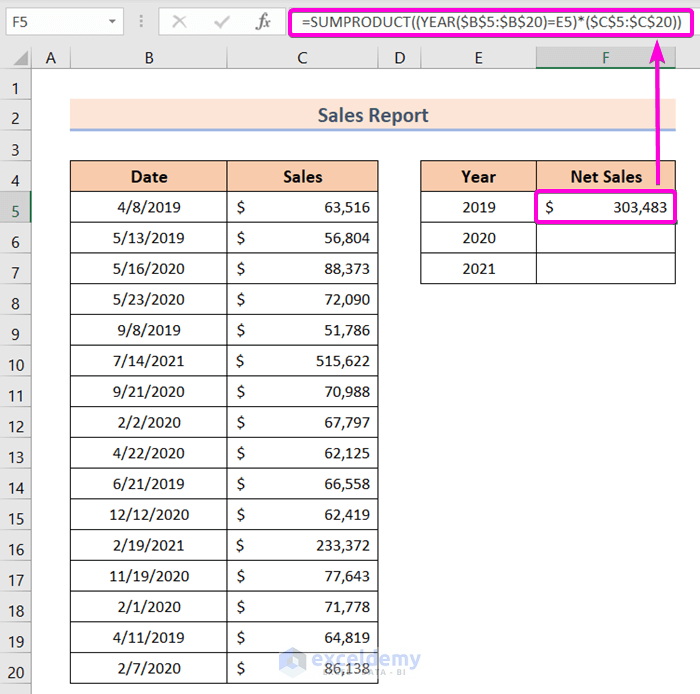
- Enter the following formula in cell F5:
=SUMPRODUCT((YEAR($B$5:$B$20)=E5)*($C$5:$C$20))- Press ENTER.
Formula Breakdown
- YEAR($B$5:$B$20) returns only the year from the dates in the range $B$5:$B$20.
- Output: {2019;2019;2020;2020;2019;2021;2020;2020;2020;2019;2020;2021;2020;2020;2019;2020}
- YEAR($B$5:$B$20)=E5 returns either TRUE or FALSE. If any year in the range $B$5:$B$20 matches with the year stored in E5, it returns a TRUE; otherwise, it returns FALSE.
- Output: {TRUE;TRUE;FALSE;FALSE;TRUE;FALSE;FALSE;FALSE;FALSE;TRUE;FALSE;FALSE;FALSE;FALSE;TRUE;FALSE}
- (YEAR($B$5:$B$20)=E5)*($C$5:$C$20): E5 represents the year 2019. Thus, YEAR($B$5:$B$20)=E5 returns an array of 1 and 0 values; 1 for the year 2019 and 0 for otherwise. The array of 1 and 0 values is multiplied parallel with the sales amount in the range $C$5:$C$20.
- Output: {63516;56804;0;0;51786;0;0;0;0;66558;0;0;0;0;64819;0}
- SUMPRODUCT((YEAR($B$5:$B$20)=E5)*($C$5:$C$20)): Sums all the sales amounts in the array {63516;56804;0;0;51786;0;0;0;0;66558;0;0;0;0;64819;0}.
- Output: $303,483.
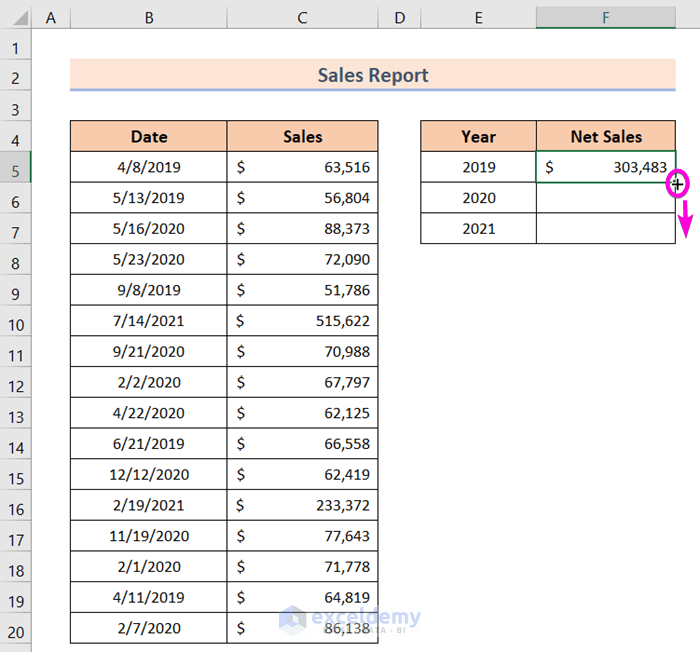
- Drag down the Fill Handle to cell F7.
We have Net Sales amounts for the years 2019, 2020, and 2021.
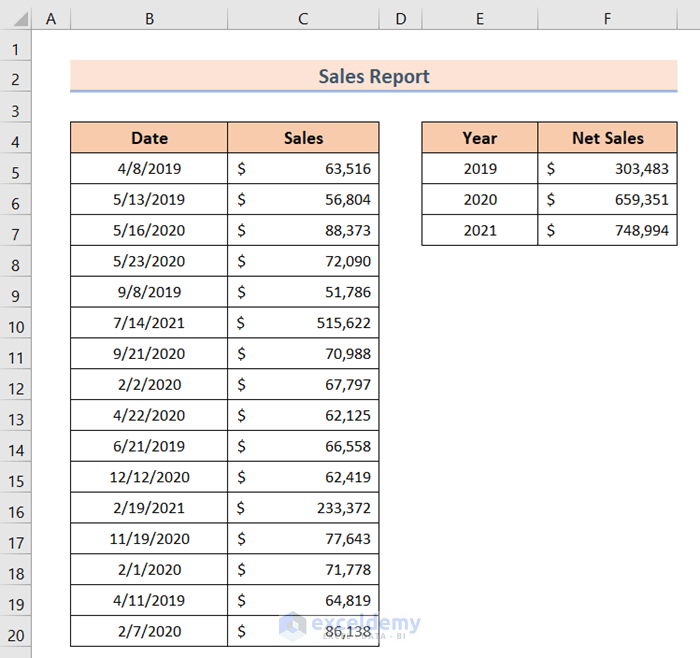
Now we’ll use this Year vs Net Sales data table to calculate sales growth over the 3 years.
How to Calculate Sales Growth over 3 Years in Excel: 2 Methods
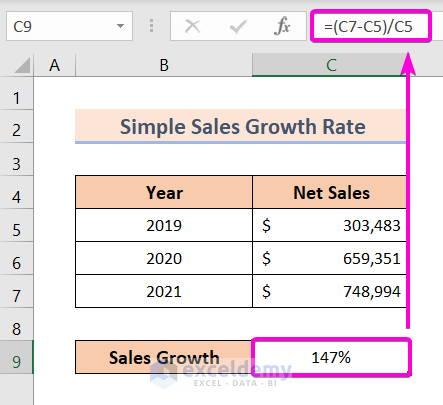
Method 1 – Calculating the Simple Sales Growth Rate over 3 Years
The generic formula for simple sales growth rate is:
=(Third Year Sales Amount - First Year Sales Amount)/First Year Sales AmountSteps:
- Enter the following formula in cell C9:
=(C7-C5)/C5Formula Breakdown
- C7 is the Third Year Sales Amount.
- C5 is the First Year Sales Amount.
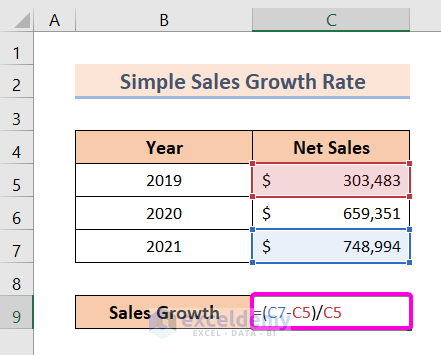
Press ENTER.
We have the simple sales growth rate over the last 3 years in cell C9.
Read More: How to Calculate Sales Growth over 5 Years in Excel
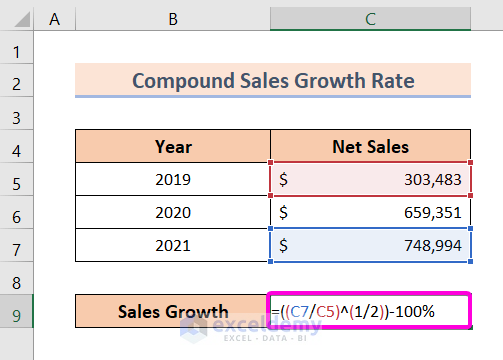
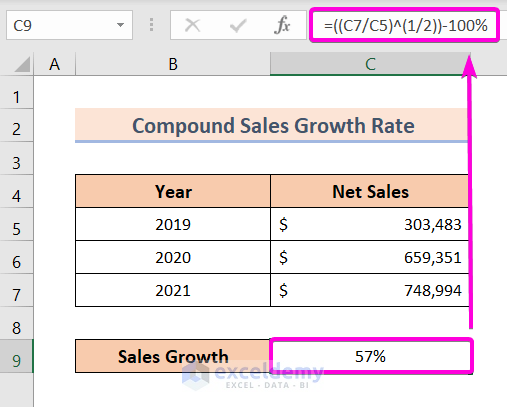
Method 2 – Calculating the Compound Sales Growth Rate over 3 Years
The generic formula to calculate the compound sales growth rate is:
=((Third Year Sales Amount/First Year Sales Amount)^(1/(Year Span -1)))-100%Steps:
Enter the following formula in cell C9:
=((C7/C5)^(1/2))-100%Formula Breakdown
- C7 is the Third Year Sales Amount.
- C5 is the First Year Sales Amount.
- (1/2) is the (1/(Year Span – 1)) part of the equation. The Year Span is 3, so 3 – 1 = 2.
Press ENTER.
We have the compound sales growth rate in cell C9.
Download Practice Workbook
Related Articles
- How to Calculate Annual Growth Rate in Excel
- How to Calculate Dividend Growth Rate in Excel
- How to Use the Exponential Growth Formula in Excel
- How to Calculate Monthly Growth Rate in Excel
- Growth Formula in Excel with Negative Numbers
- How to Calculate Year over Year Growth with Formula in Excel
- Growth Over Last Year Formula in Excel
- How to Calculate Growth Percentage with Formula in Excel
<< Go Back to Growth Formula In Excel | Excel Formulas for Finance | Excel for Finance | Learn Excel
Get FREE Advanced Excel Exercises with Solutions!
