Looking for ways to calculate conditional probability in Excel? Then, this is the right place for you. Here, you will find 2 easy ways to calculate ...
Method 1 - Creating Variable for GST Calculator
You need to assign variable names for calculating GST interest and put them in the column headings. ...
Method 1 – Using a Keyboard Shortcut
Below are the blank cells where we will paste the image from the clipboard. We have also resized the cell size ...
To know the financial stability of a company or organization, we use the Balance Sheet. We can apply different Excel formulas and different features ...
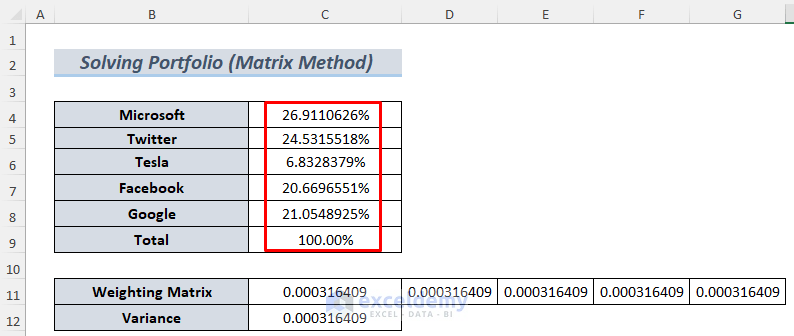
A variable width column chart portrays data in a more convenient way as the columns correspond to the values in the dataset, unlike a simple column ...
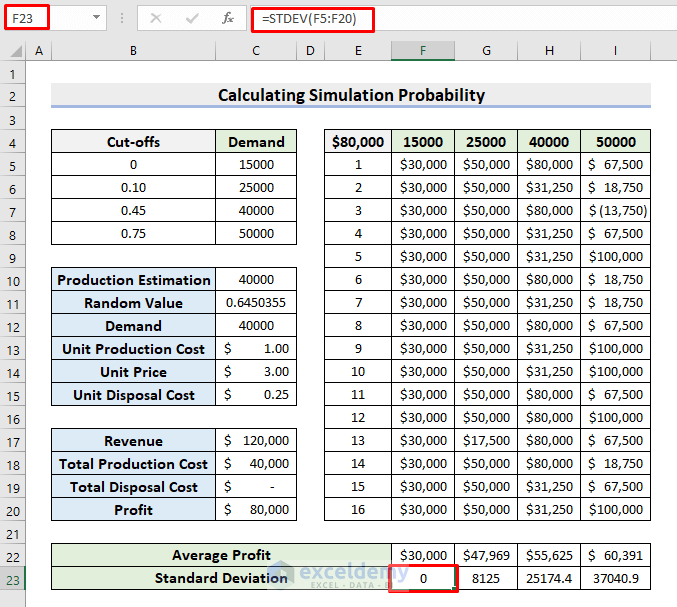
In this article, we will learn to find the Discrete Probability Distribution in Excel. A discrete probability distribution indicates the probability ...