If you are searching for ways to pivot table group by different intervals, this is the right place for you. Sometimes, we have to make pivot tables using data with uneven intervals. In those cases, we have to follow some simple steps. Here, in this article, you will find step-by-step ways to pivot tables group by different intervals.
What Is a Pivot Table?
In Excel, a Pivot Table is a copy of your original table with source data. A Pivot Table can provide rapid answers to questions about your table that might otherwise require complex calculations to solve. It can be used to summarise the data which is easily understandable to the viewers.
What Does Pivot Table Grouping by Different Intervals Mean?
Using the Pivot Table, we can represent the data which is grouped in some specific intervals. We can also group the data in uneven or different intervals using some functions.
How to Use Pivot Table to Group by Different Intervals in Excel: 3 Creative Ways
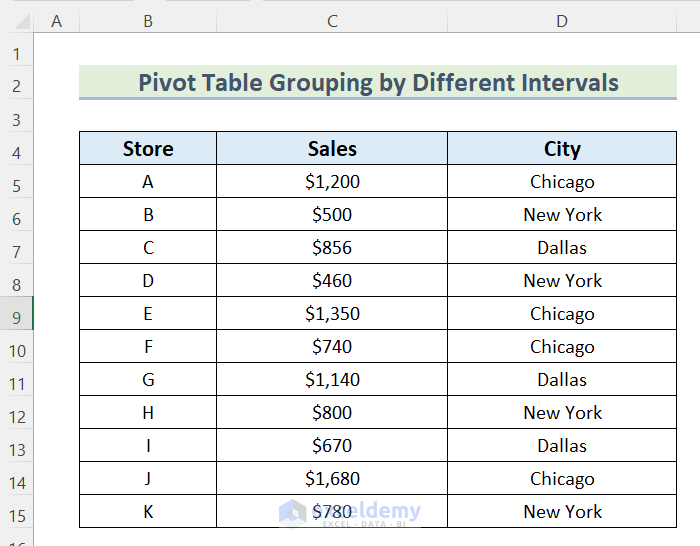
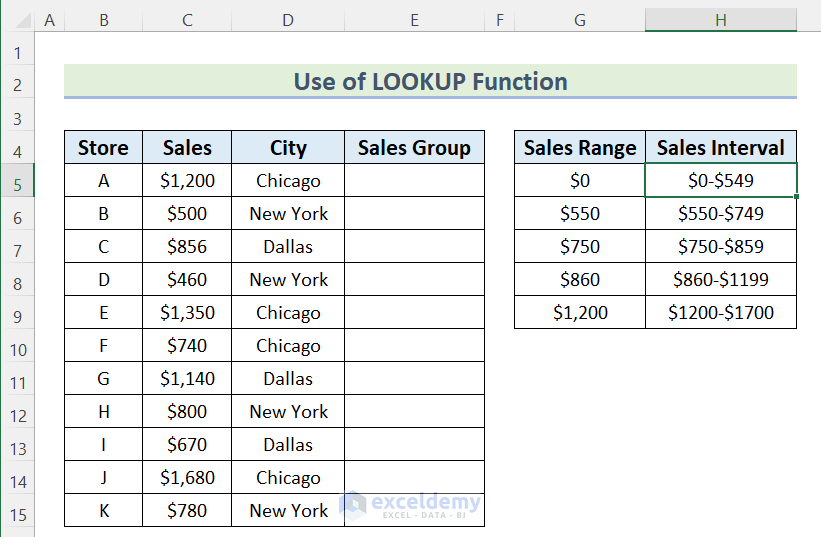
Here, we have a dataset of Sales of some stores containing Store name, Sales and City. We will use this dataset to create a Pivot Table which will be grouped by different intervals.
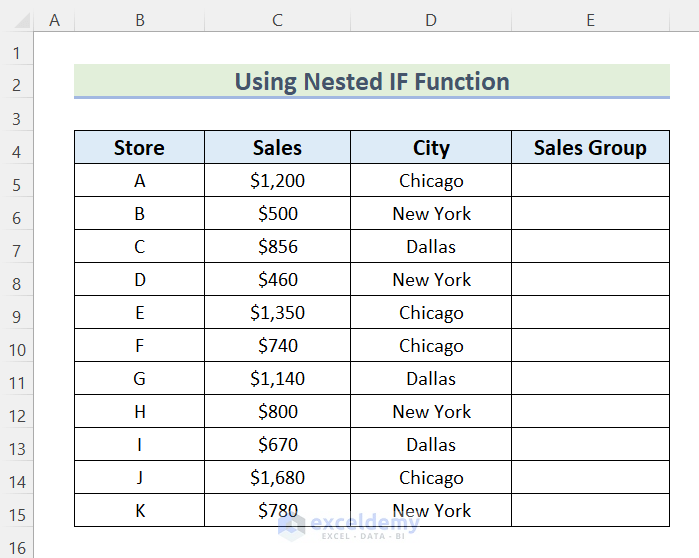
1. Using Nested IF Function to Group by Different Intervals in Pivot Table
In the first method, we will use the Nested IF function to group by different intervals in the pivot table. The Nested IF function is used when we have to use more than one condition.
Follow the steps given below to do it on your own.
Steps:
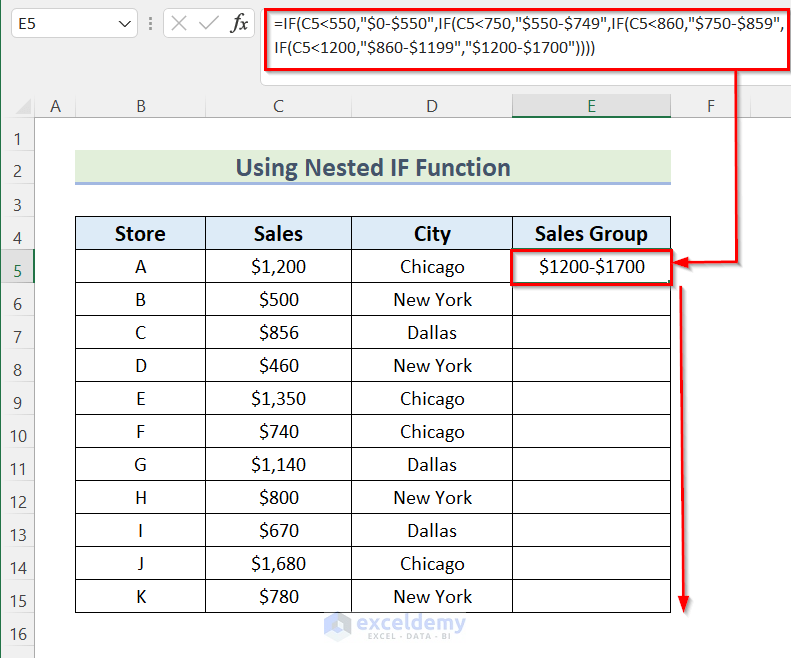
- First, click on Cell D5.
- Then, insert the following formula.
=IF(C5<550,"$0-$550",IF(C5<750,"$550-$749",IF(C5<860,"$750-$859",IF(C5<1200,"$860-$1199","$1200-$1700"))))
Here, we used the Nested IF function where we used 4 logical_test to check the Sales Group for Sales. First, we are checking if the Salary of C5 is less than 550 or not. Next, as value_if_true we used the value “$0-$550” and for value_if_false used another IF function to check another range for 750. By following this we used 4 logical_test within 4 IF functions to determine the Sales Group of different ranges of the Sale.
- After that, press ENTER to get the value of Sales Group.
- Then, drag down the Fill Handle tool to AutoFill the formula for the rest of the cells.
- Now, you will get the Sales Group accounting to the amount of Sales of that Store.

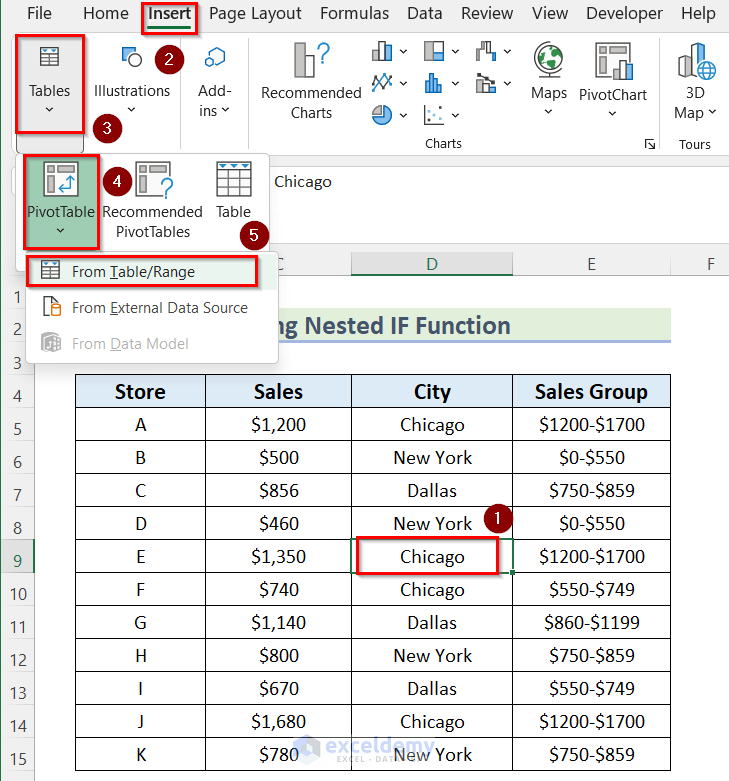
- Then, click on any Cell in the table according to your preference. Here, we clicked on Cell D9.
- After that, go to Insert tab >> click on Tables >> click on PivotTable >> select From Table/Range.
- PivotTable from table or range will appear.
- Here, the Table/Range box has selected the table.
- Then, press OK.

- After that, the PivotTable Fields box will open.
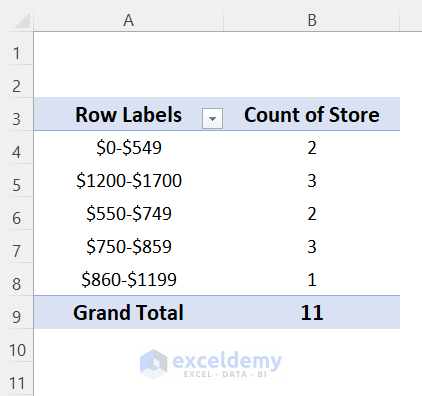
- Then, put the Sales Group in the Rows box and Store in the Values box.

- Finally, you will get the Pivot Table grouped by different Intervals.

Read More: How to Group Rows in Excel Pivot Table
2. Use of LOOKUP Function to Group by Different Intervals in Pivot Table
We can also create a Pivot Table which is grouped by different intervals using the LOOKUP function. Here, we have an additional table containing the Sales lower Range and Sales Interval.
Go through the following steps to do it on your own.
Steps:
- In the beginning, click on Cell D5.
- After that, insert the following formula.
=LOOKUP(C5,$G$5:$G$9,$H$5:$H$9)
Here, in the LOOKUP function, we selected Cell C5 as lookup_value, selected Cell G5:G9 as lookup_vector and H5:H9 as result_vector. It will search the Sales Group from the Sales Interval.
- Now, press ENTER to get the value of Sales Group.
- Then, drag down the Fill Handle tool to AutoFill the formula for the rest of the cells.
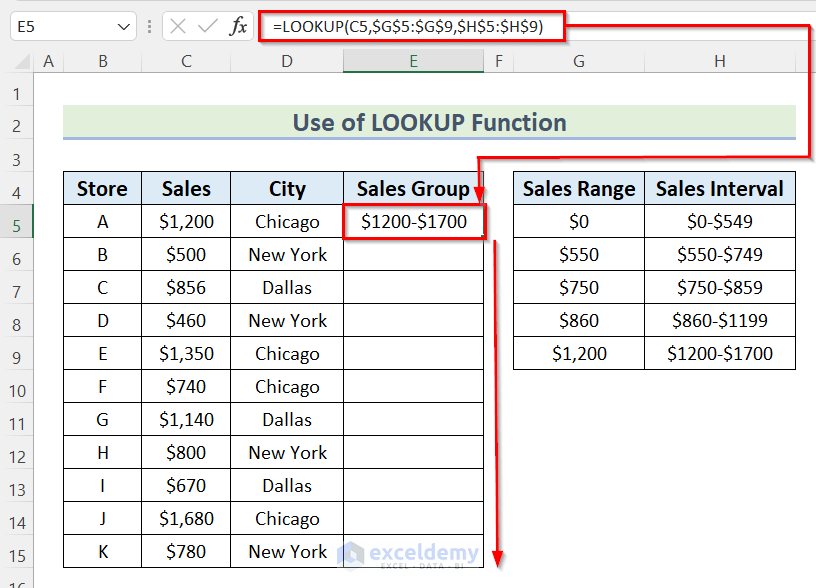
- Now, you will get the Sales Group accounting to the number of Sales of that Store.

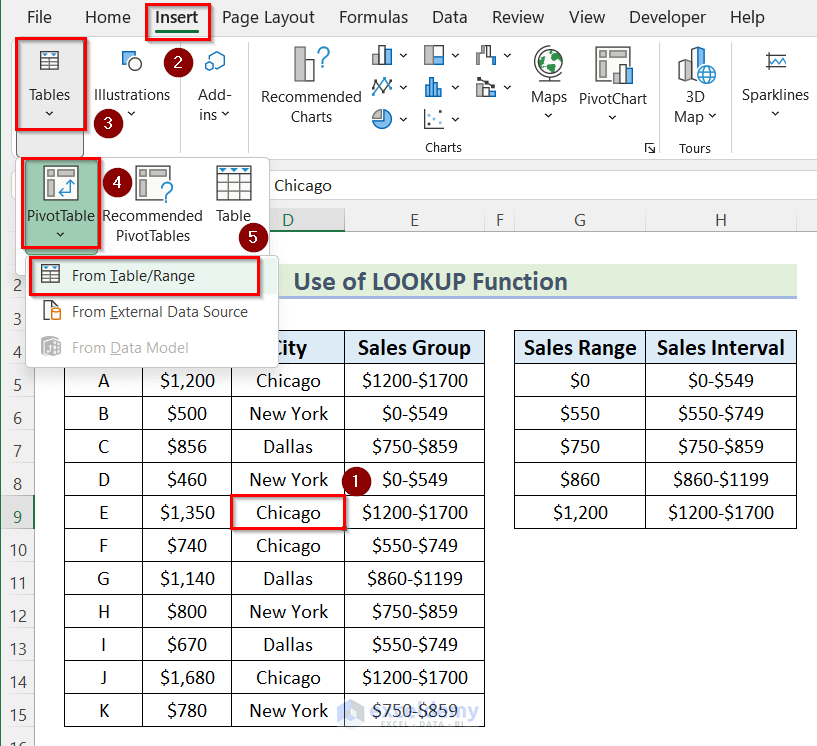
- After that, click on any Cell in the table according to your preference. Here, we clicked on Cell D9.
- Then, go to Insert tab >> click on Tables >> click on PivotTable >> select From Table/Range.
- PivotTable from table or range will appear.
- Now, Table/Range box you will notice that it has selected the table.
- Then, press OK.

- After that, the PivotTable Fields box will open.
- Now, put the Sales Group in the Rows box and Store in the Values box.
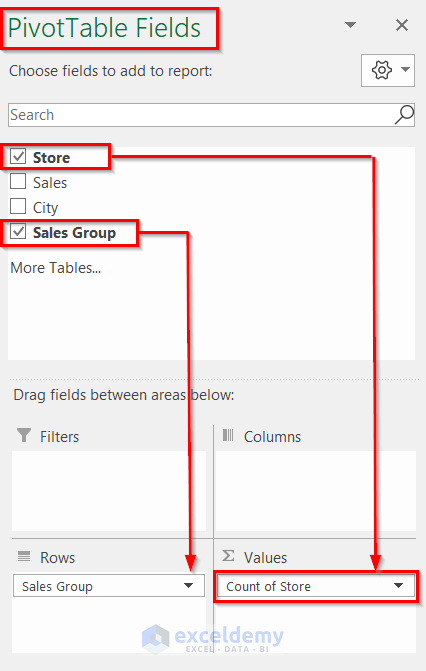
- Here, you can find the Pivot Table created using the LOOKUP function.

Read More: How to Group Columns in Excel Pivot Table
3. Applying VLOOKUP Function to Group by Different Intervals in Pivot Table
In the final method, we will use the VLOOKUP function to group by different intervals in the Pivot Table. Follow the steps given below to do it on your own.
Steps:
- First, click on Cell D5.
- Then, insert the following formula.
=LOOKUP(C5,$G$5:$G$9,$H$5:$H$9)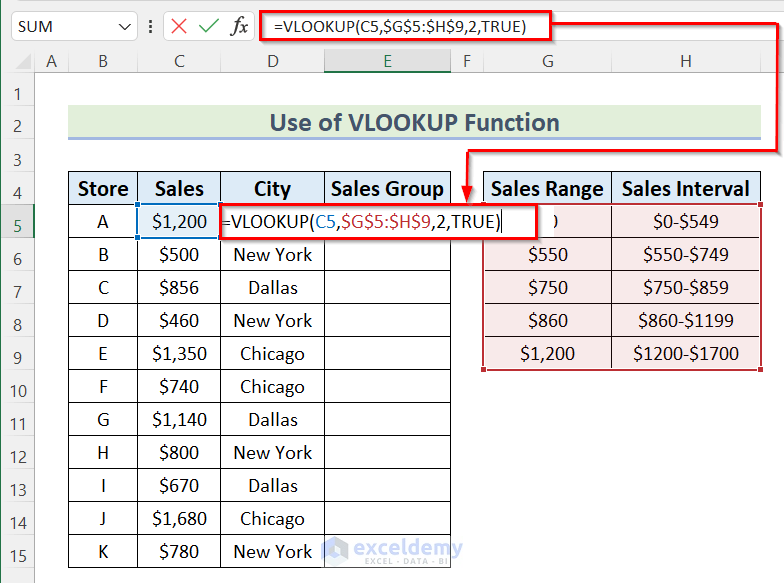
Here, in the VLOOKUP function, we selected Cell C5 as lookup_value, selected Cell G5:H9 as table_array, 2 as column_index_number from where the value of Sales Group will be extracted. Then, TRUE as range_lookup to get the Approximate Match.
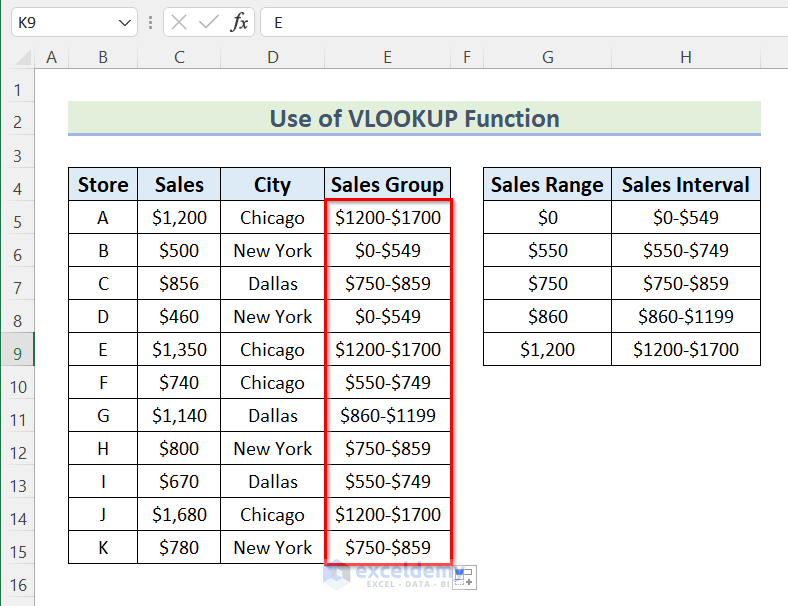
- After that, press ENTER to get the value of Sales Group.
- Then, drag down the Fill Handle tool to AutoFill the formula for the rest of the cells.

- Here, you can see the Sales Group grouped by different intervals according to the value of Sales.
- Then, click on any Cell in the table according to your preference. Here, we clicked on Cell D9.
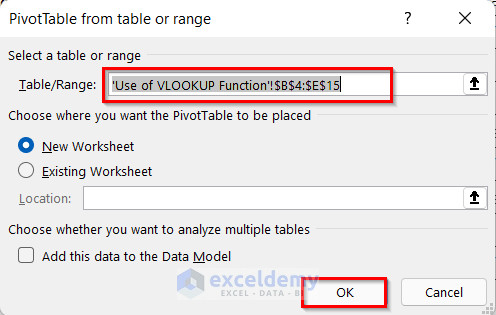
- After that, go to Insert tab >> click on Tables >> click on PivotTable >> select From Table/Range.

- Now, PivotTable from table or range will appear.
- After that, in the Table/Range box notice that the table is selected.
- Then, press OK.
- After that, the PivotTable Fields box will open.
- Then, put the Sales Group in the Rows box and Store in the Values box.
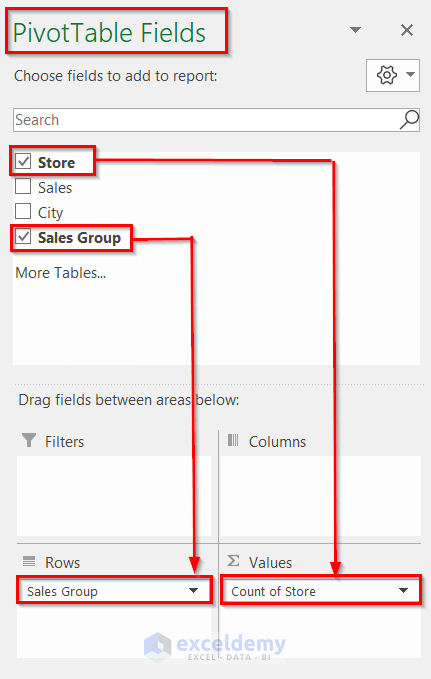
- Finally, you will find Pivot Table grouped by different Intervals.
Read More: Pivot Table Custom Grouping
Things to Remember
- #N/A error can occur while using the LOOKUP and VLOOKUP functions. It indicates that the formula can’t find what it’s been looking for.
- #VALUE! error occurs while using the VLOOKUP function when a value used in the formula is of the wrong data type.
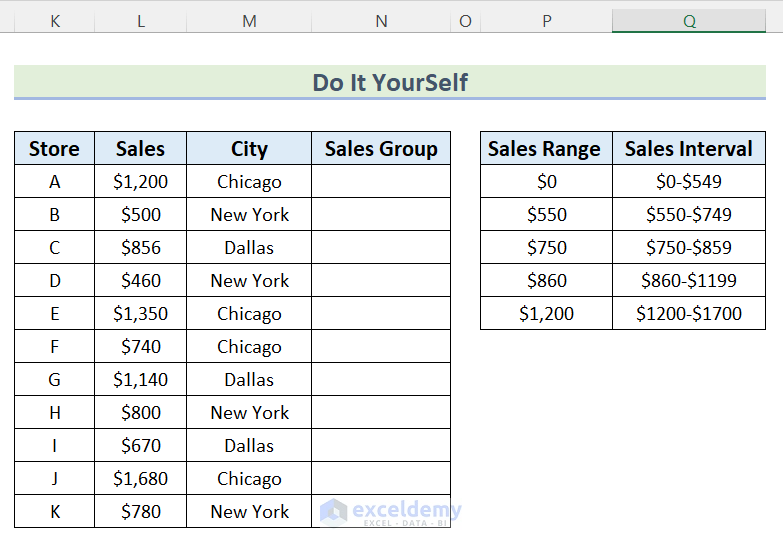
Practice Section
In the article, you will find an Excel workbook like the image given below to practice on your own.
Download Practice Workbook
Conclusion
So, in this article, we have shown you how to pivot table groups by different intervals. I hope you found this article interesting and helpful. If something seems difficult to understand, please leave a comment. Please let us know if there are any more alternatives that we may have missed. Thank you!
Related Articles
- [Fixed] Excel Pivot Table: Cannot Group That Selection
- How to Group Numbers in Excel Pivot Table
- How to Make Group by Same Interval in Excel Pivot Table
- How to Rename a Default Group Name in Pivot Table
<< Go Back to Group Pivot Table | Pivot Table in Excel | Learn Excel
Get FREE Advanced Excel Exercises with Solutions!
