If you are searching for ways to organize expenses in Excel, then this is the right article for you. If we organize our expenses well, we can minimize them as well. We are going to show you 3 templates to organize expenses in Excel.
By organizing expenses in Excel, you can achieve the following things:
- Save time and money.
- Visualize the data.
- Make better monetary decisions.
- Identify strange transactions.
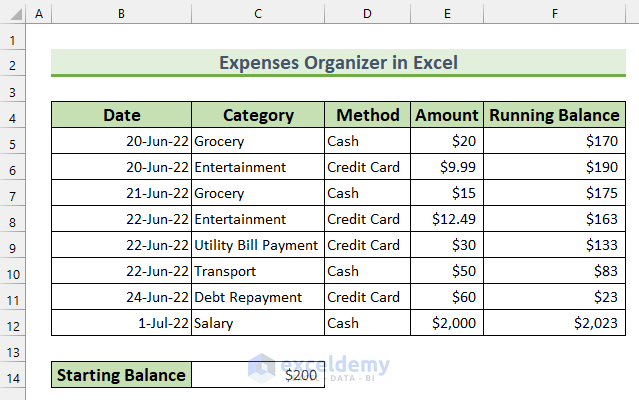
There will be three templates to organize expenses in Excel in our article. Here is the first template for organizing personal expenses. This has 5 columns consisting of “Date”, “Category”, “Method”, “Amount”, and “Running Balance”. Additionally, we will show 2 more templates to organize business travel and monthly business expenses.
1. Organizing Personal Expenses in Excel
For the first method, we will construct a template to organize personal expenses. Then, we will be using the SUM function to create a cumulative sum in our template. Afterward, we will insert a Pie Chart and a Clustered Column Chart to visualize our expenses.
Steps:
- To begin with, create the following column headers: “Date”, “Category”, “Method”, “Amount”, and “Running Balance”.
- Next, type the expense information into the relevant cells. Moreover, our data start from June 20, 2022, hence, we will not consider any previous expenses or incomes.

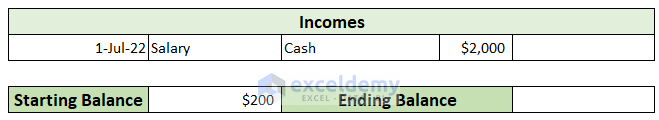
- Afterward, add Incomes to the template. Here, we received our payment on July 1, 2022.
- Then, add Starting Balance, our balance was $200 on June 20, 2022.
- After that, add a field for the Ending Balance. We’ll input this from the Running Balance column’s latest value.
- Now, we will add the cumulative sum to our expenses in the Running Balance column.
- So, select the cell range F6:F12 and type the following formula.
=$C$17-SUM($E$6:$E6)

- Afterward, press CTRL+ENTER. This will AutoFill the formula in cell range F6:F12.
- So, the output will look like this.
- Then, type this formula in cell F15.
=F12+E15
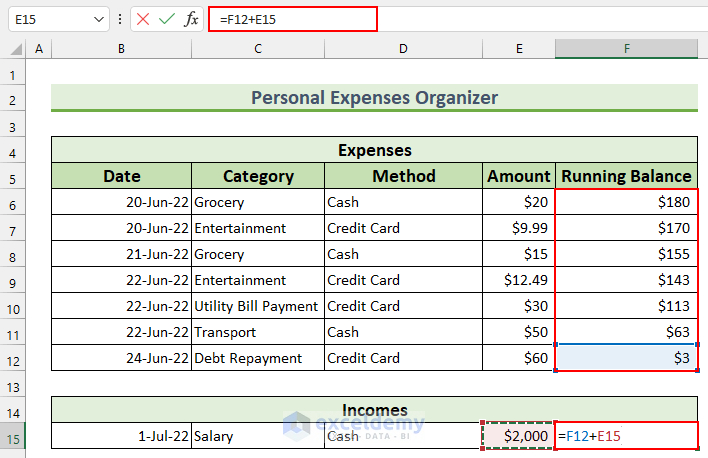
- After that, press ENTER.
- Then, we will find the Ending Balance. In our case, it is the value from cell F15.
- So, type the following formula in cell F17.
- Lastly, press ENTER.
=F15

- We have completed the template for organizing personal expenses. Now, we will add two Charts to visualize the data in a meaningful way.
- Before doing so, we may face a problem if we create the Pie Chart directly by selecting the cell range C6:C12 and E6:E12.
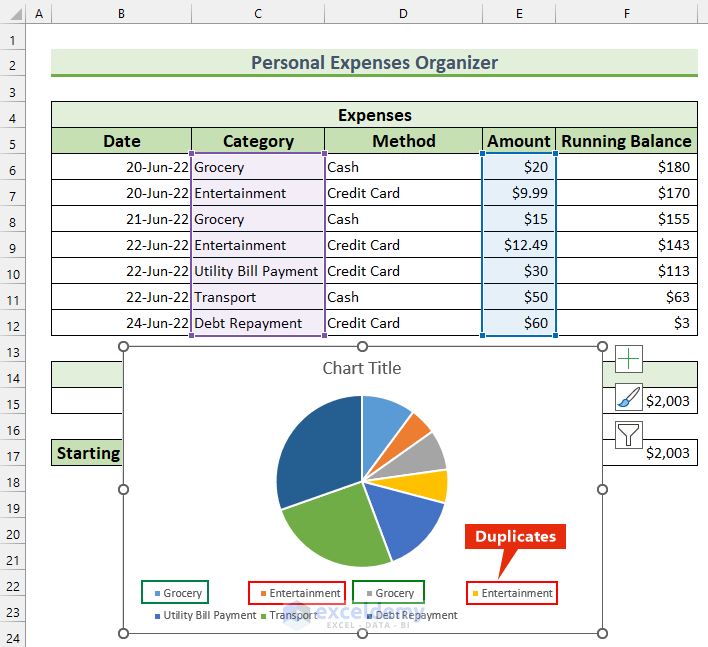
Therefore, we cannot insert the Pie Chart directly. To do so, we can use the PivotTable.
- Firstly, select anywhere inside the Expenses data range.
- Then, from the Insert tab >>> select PivotTable.
- So, the “PivotTable from table or range” box will appear.
- Next, select “Existing Worksheet” and cell B19 as the location.
- Finally, press OK.

- After that, a blank PivotTable will appear.
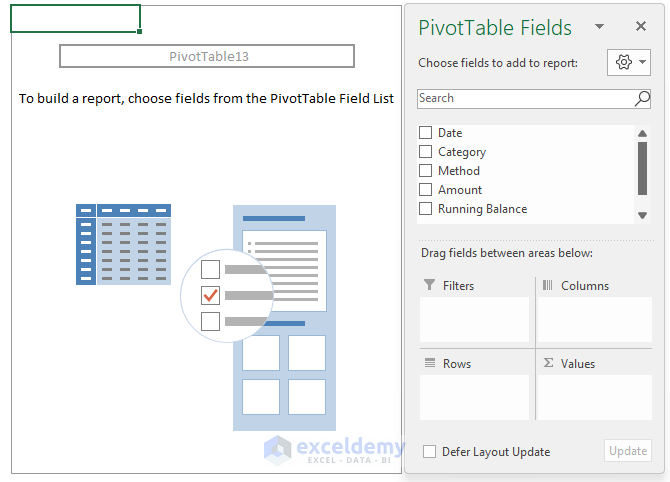
- Now, select “Category”, and “Amount”. Excel will put these two fields automatically in the Rows and Values area respectively. Moreover, if this does not work for you, you manually drag the fields to the destination.

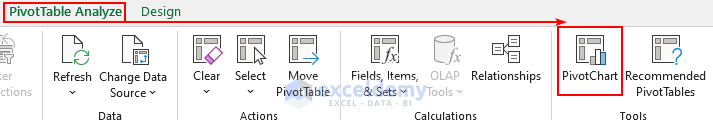
- Next, click anywhere inside the PivotTable.
- Then, from the PivotTable Analyze tab >>> select PivotChart.
- Afterward, the Insert Chart window will appear.
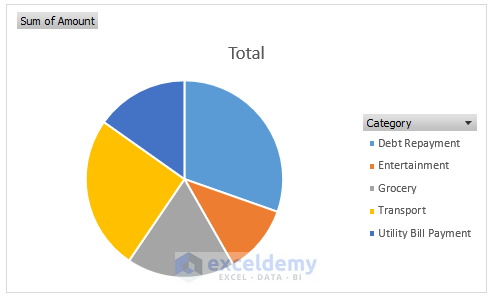
- Next, select Pie from the left side of the window and press OK.

- After that, this Pie Chart will appear.
- Now, we will modify the Pie Chart.
- Firstly, we add Data Labels to the Chart.
- To do so, from the Chart Elements >>> Data Labels >>> select “More Options…”.

- Then, the “Format Data Labels” option will pop up.
- After that, under the “Label Options” –
- Deselect Value.
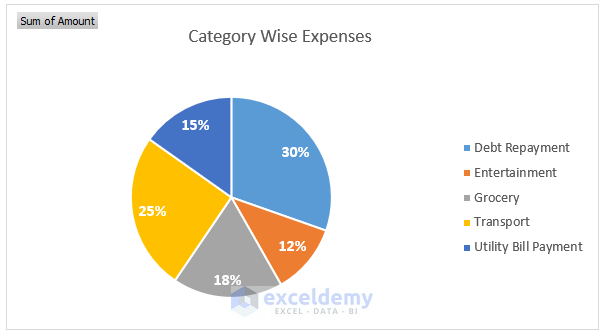
- Select Percentage.

- Then, our Chart will look like this.

- After that, we will add more formatting to the Chart such as – changing the font color, and font size and adding a Chart Title.
- After that, we insert a Clustered Column Chart.
- Firstly, select the cell range D6:E12.
- Next, from the Insert tab, select Recommended Charts.

- Again, the Insert Chart window will pop up.
- Then, select Clustered Column and press OK.
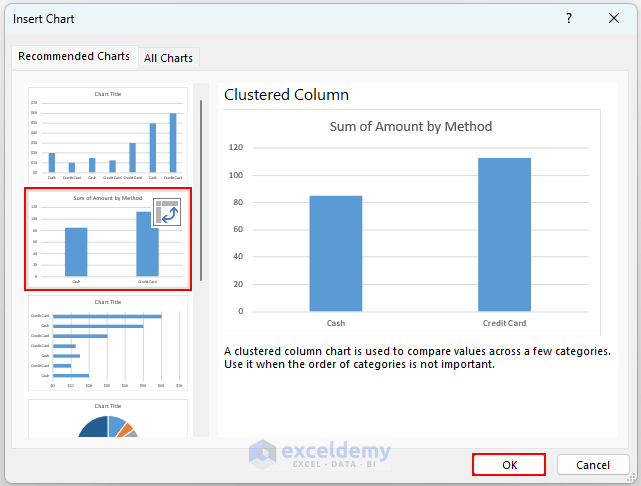
- Therefore, the default Clustered Column Chart will appear.

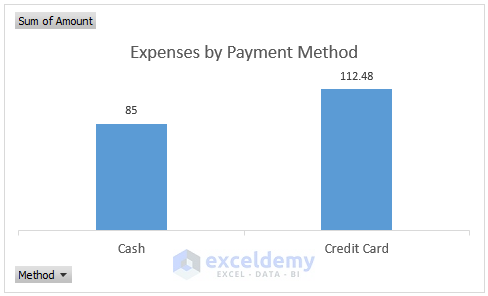
- Afterward, we add Data Labels, and the Chart Title and increase font size.
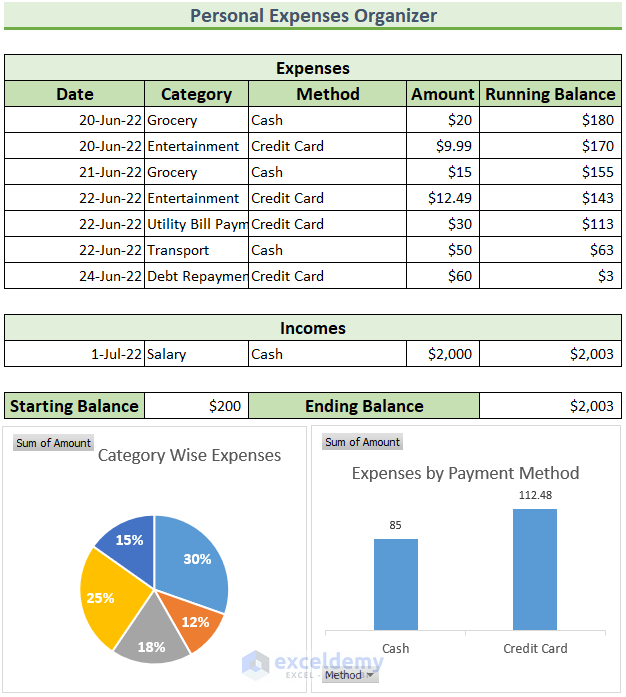
- Thus, we have completed the template to organize expenses.
- Lastly, this is what the overall template should look like.
Read More: How to Organize Information in Excel
2. Organizing Travel Expenses in Excel
In this section, we will create another template to organize business travel expenses. The business travel expenses can include- Ticket Price, Hotel Fare, Food Costs, and any other miscellaneous expenses. After that, we will use the SUM function to add Totals to organize the expenses.
Steps:
- Firstly, add the following information:
- Employee Name – Mr. John.
- Employee Role – Sales Associate.
- Employee ID – 55.
- Travel Location – Paris.
- Travel Purpose – Generate Sales.
- Travel Start Date – 6/22/2022.
- Then, insert the Company Logo into the template.

- After that, type these expense data with the following columns: “Date”, “Description”, “Lodging”, “Transportation”, “Food”, and “Miscellaneous”.

- Then, we will find the Sub Total.
- So, select the cell range D13:G13 and type this formula.
=SUM(D9:D12)
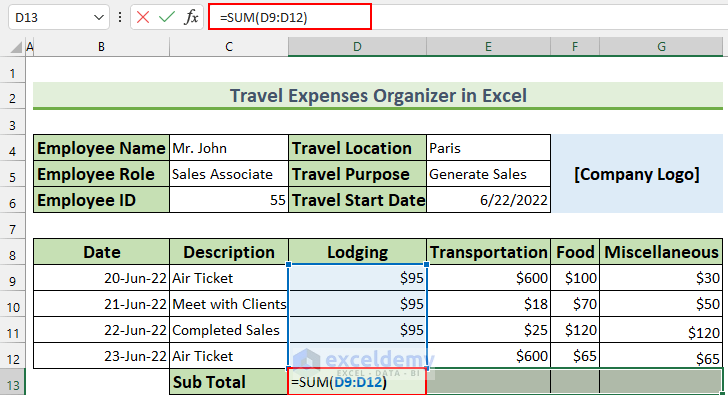
- Then, press CTRL+ENTER. This will AutoFill the formula.

- After that, we calculate the Total expenses.
- Therefore, type this formula in cell G14.
=SUM(D13:G13)
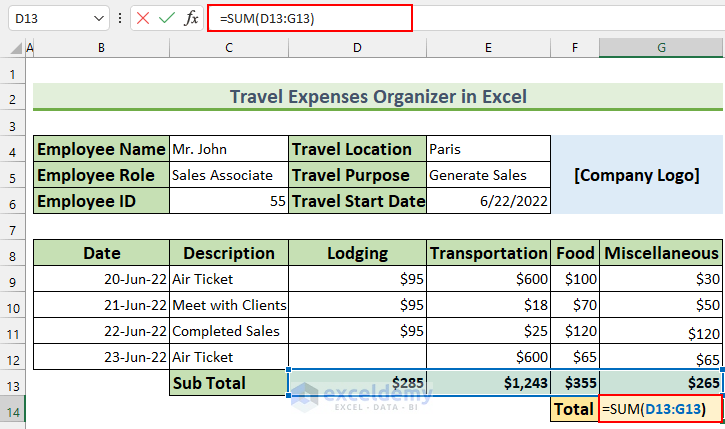
- Then, press ENTER.
- Lastly, add space for Comments and Signatures. By doing so, our template to organize expenses will conclude.

3. Organizing Business Expenses in Excel Using Built-in Template
For the last method, we will insert a Built-in template to organize expenses in Excel.
Steps:
- To begin with, press ALT, F, N, and then S to activate the Search for online templates box.
- Next, type “expenses” in that search box.
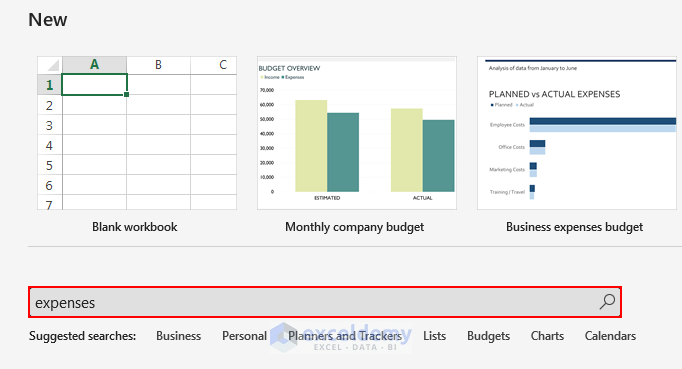
- Then, press ENTER.
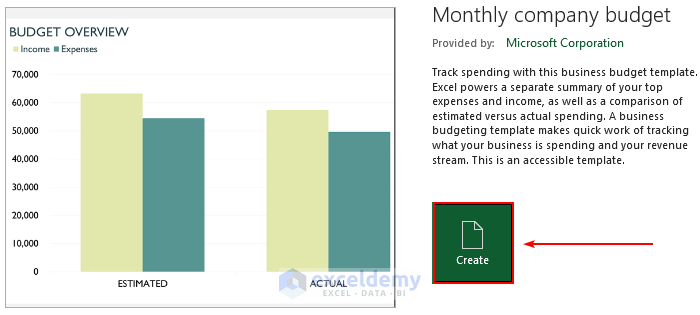
- After the search results return, select “Monthly company budget”.

- Then, a dialog box will appear, press Create.
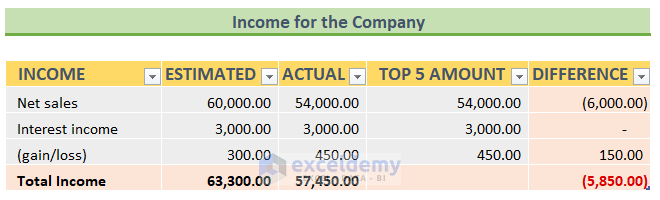
- Then, the template will open in a new Excel Workbook. For better demonstration, we have imported that to our ongoing Excel file. There will be 4 new Sheets and we will go through each Sheet.
- The first one is the overview of the expenses. This template calculates the difference between the estimated balance and the actual balance. Moreover, this shows us the top 5 expenses and a Column Chart to visualize this.

- Then, in the second Sheet, it organizes the Incomes for the company.
- Next, the template organizes the personal expenses for the company.

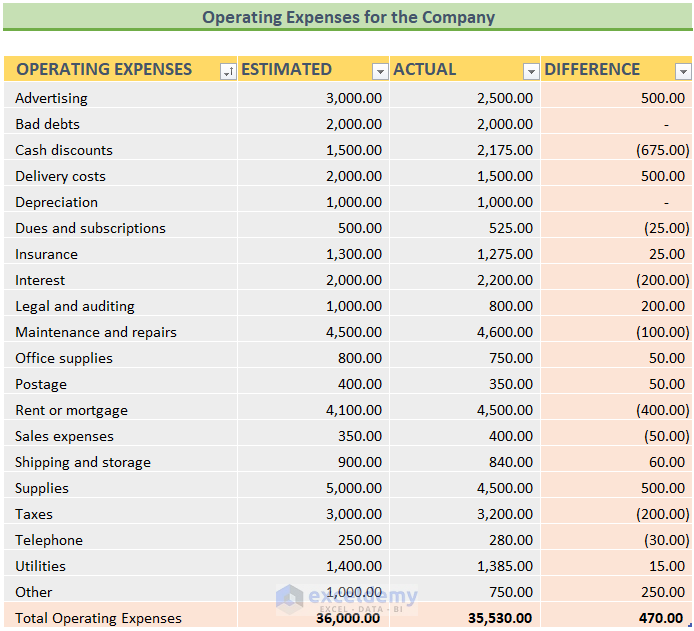
- Afterward, the last Sheet organizes the operating expenses in Excel.
- Finally, we can edit these values to better organize the expenses for any company.
Read More: How to Organize Sales Leads in Excel
Download Practice Workbook
You can download the free templates from here.
Conclusion
We have shown you 3 handy templates for how to organize expenses in Excel. If you face any problems regarding these methods or have any feedback for me, feel free to comment below. Thanks for reading, keep excelling!
Related Articles
- How to Organize Data for Analysis in Excel
- How to Organize Things Alphabetically in Excel
- How to Organize Data in Excel from Lowest to Highest
- How to Organize Time in Excel
- How to Organize Raw Data in Excel
<< Go Back to Organize Data in Excel | Data Analysis with Excel | Learn Excel
Get FREE Advanced Excel Exercises with Solutions!
