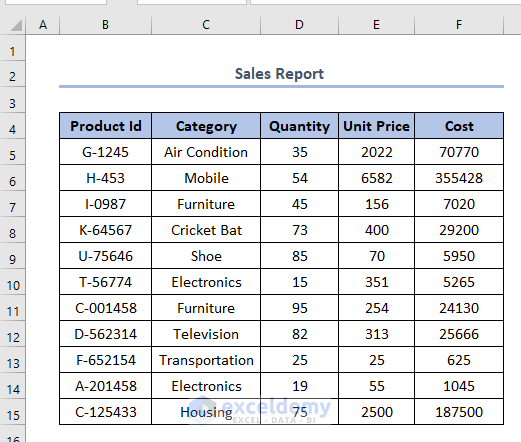
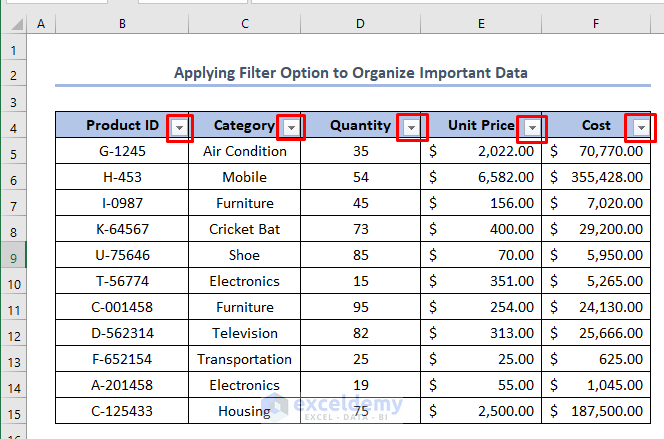
We have prepared a dataset containing Product ID, Category, Quantity, Unit Price, and Cost of some companies. Let’s organize the dataset through some common options (Note that these are only a few of the methods you can use, so feel free to experiment).
Method 1 – Applying Format Settings to Organize Data in Excel for Analysis
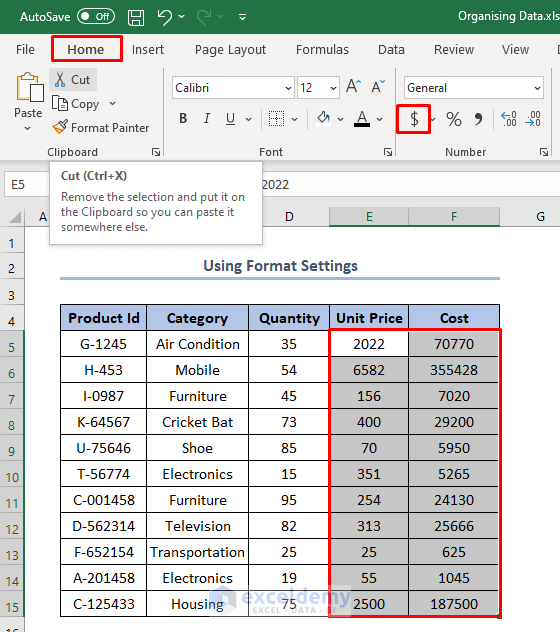
We have monetary values in columns E and F. We’ll display the cells in these columns in Accounting format.
- Select all the cells in columns E and F.
- Select the $ sign under the Number group on the Home tab.
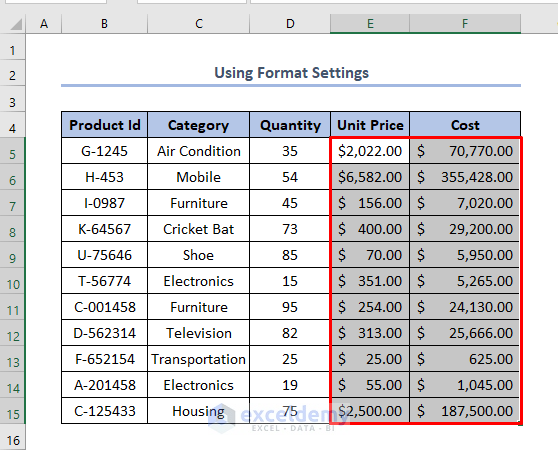
- The Unit Price and Cost cells will be in the Accounting format.
Read More: How to Organize Raw Data in Excel
Method 2 – Sorting Data for Analysis
Let’s sort our data by Quantity and by Cost.
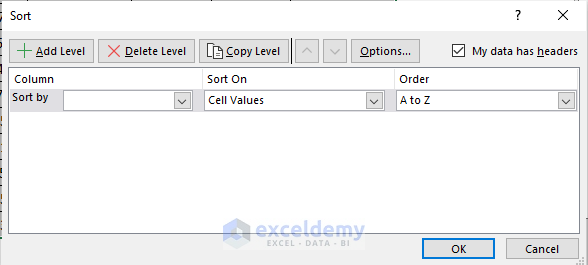
- Select a heading cell and click on Sort (from the Data tab).
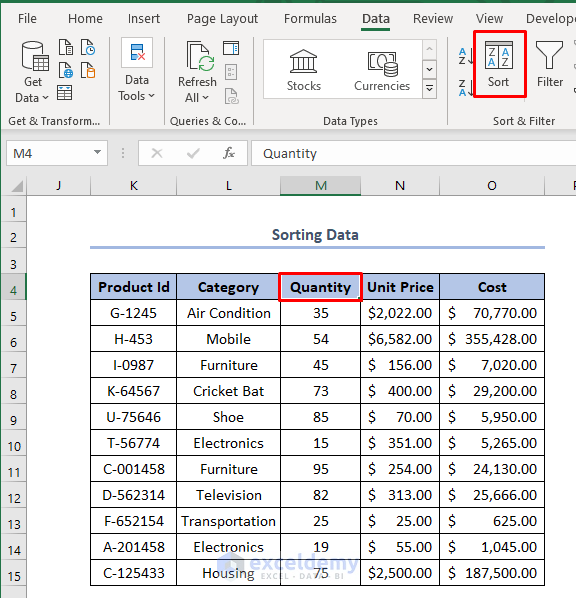
- You’ll see that sorted labels are now available in the headings of the C4 column.
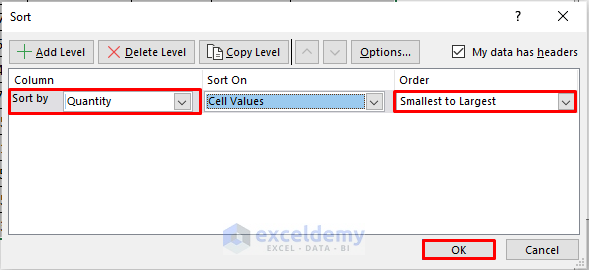
Case 2.1 – Sorting Data by Quantity
We’ll sort the items by Quantity in ascending order (from lowest to highest).
- Select any of the sorting labels from A4 to F4. A Sort window will appear.
- Select Quantity and Smallest to Largest like in the picture below in the Sort by and Order field, respectively.
- Click OK.
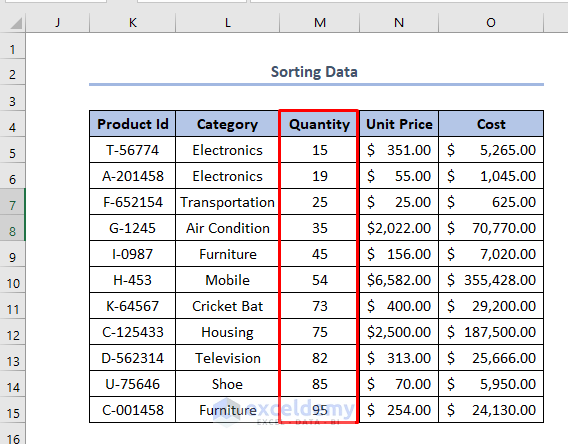
- Here are the results.
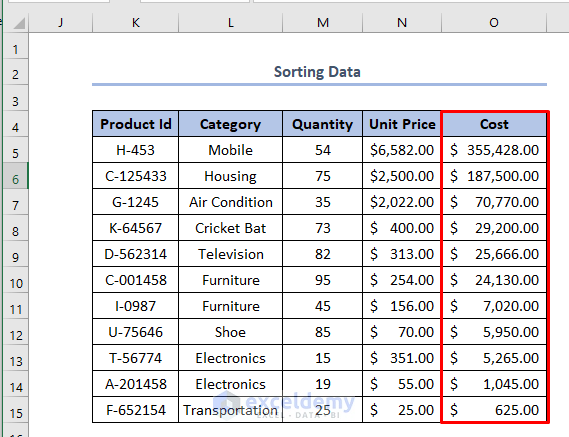
Case 2.2 – Sorting Data by Cost
We’ll use a copy of the dataset from K to O columns. To sort the Cost in descending order:
- Click on any of the sort labels from cell K4 to O4.
- Select Cost and Largest to Smallest in the Sort by and Order field, respectively.
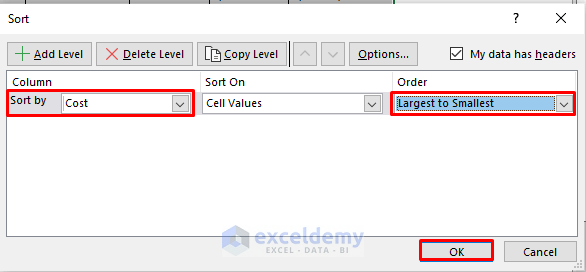
- Click OK.
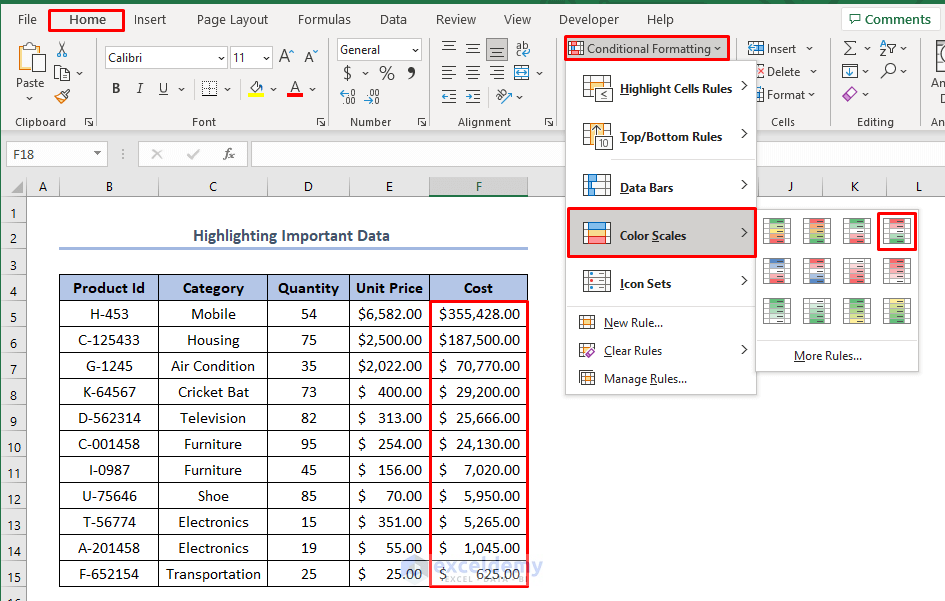
Method 3 – Highlighting Important Data in Excel for Analysis
- Select cells in the F5:F15 range.
- Go to the Home tab and select Conditional Formatting.
- Choose Color Scales and select the fourth option, Red to White to Green Color Scale.
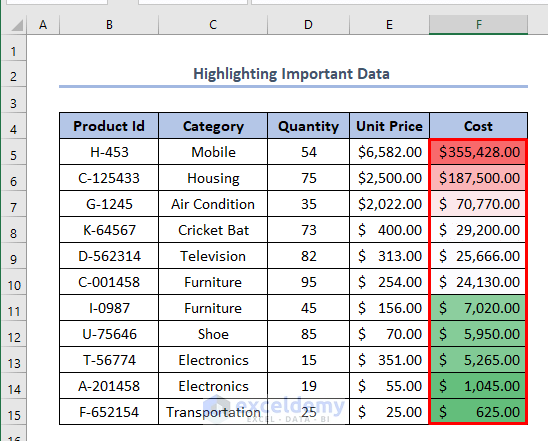
- The cell with the highest value is colored dark red. As the value decreases, the color gradually fades and then again takes on a green color for the lowest values.
Read More: How to Organize Information in Excel
Method 4 – Hiding Unnecessary Data in Excel
- Select the cells that you want to hide. We have selected Row 6 and Row 10.
- Go to the Home tab and click on Cells.
- Click Format, choose Hide & Unhide, and select Hide Rows.
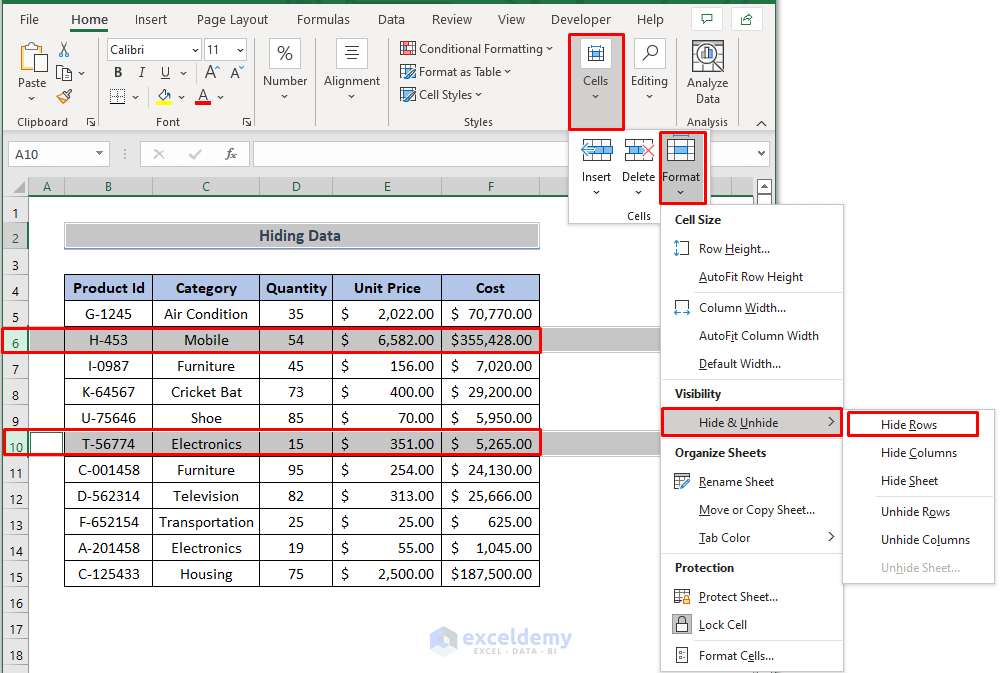
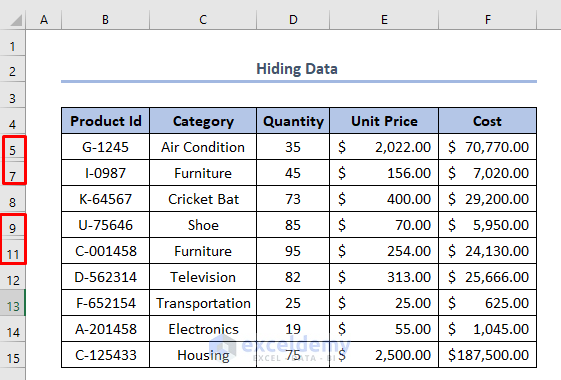
- Row 6 and Row 10 have been hidden.
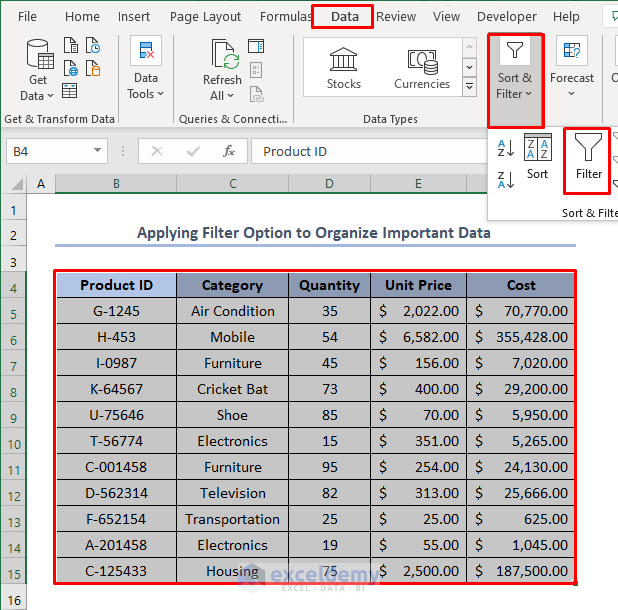
Method 5 – Using the Filter Option to Organize Data in Excel
- Select all the cells that you want to filter.
- Go to Data and click Filter.
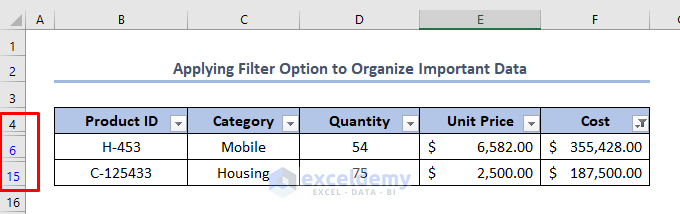
Use the Filter to then modify the data as necessary. Suppose we want to Filter the Cost column and want to keep values that are greater than 100,000.
- Click on the Filter label for Cost i.e. cell F4.
- Click Number Filters and select Greater Than Or Equal To.
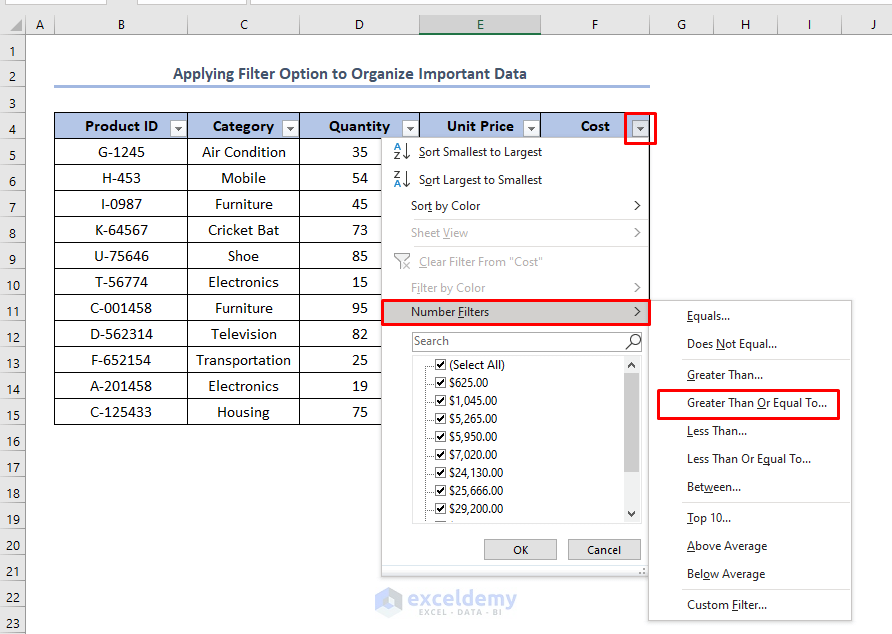
- A Custom AutoFilter will appear. Put 100000 in the box.
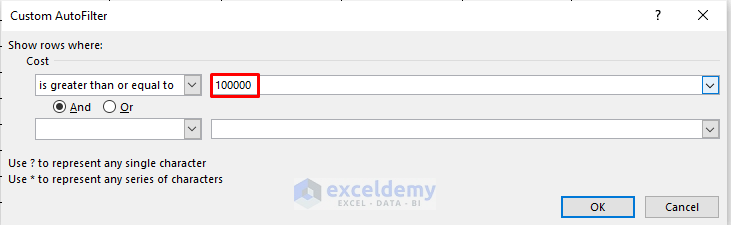
- Click OK. Only values in the Cost column which are greater than 100,000 are present, with the other rows hidden away.
Download the Practice Workbook
Related Articles
- How to Organize Things Alphabetically in Excel
- How to Organize Expenses in Excel
- How to Organize Time in Excel
- How to Organize Data in Excel from Lowest to Highest
<< Go Back to Organize Data in Excel | Data Analysis with Excel | Learn Excel
Get FREE Advanced Excel Exercises with Solutions!
