Whether you are wondering how to remove a chart border in Excel, you have come to the perfect spot. We regularly need to build charts in Excel for the purposes of various jobs or projects. To properly display or portray the chart, we must eliminate the borders. In this post, we will look at how to remove a chart border in Excel.
How to Remove Chart Border in Excel: Quick Steps
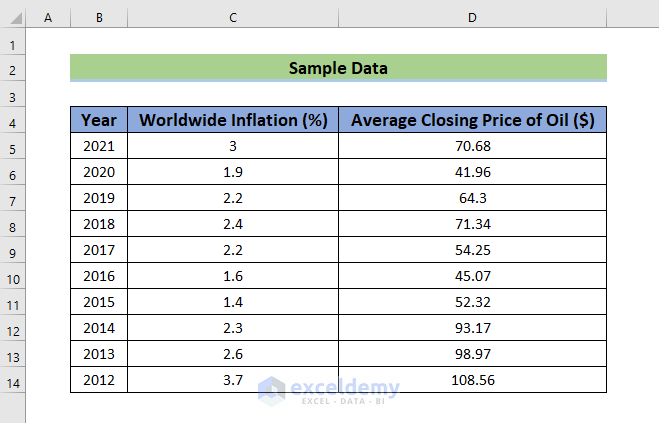
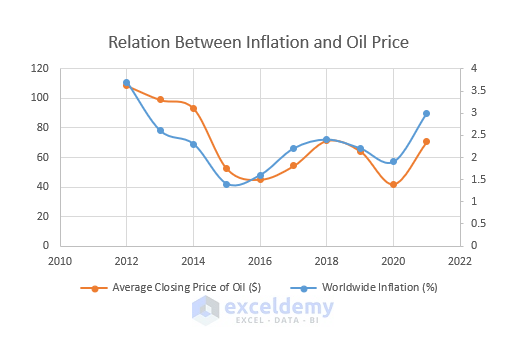
Assuming that we have the following data of the accompanying figure, we are going to discuss an Excel process to remove the chart border. In this data, we have Year, Worldwide Inflation (%), and Average Closing Price of Oil ($) columns.
After proper procedures, we created an Excel chart with this data like the following image.
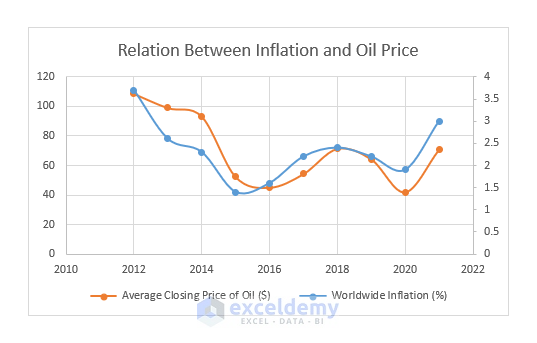
We have added border around the chart and for some reason, we need to remove the border part from the chart. Let’s see the workaround.
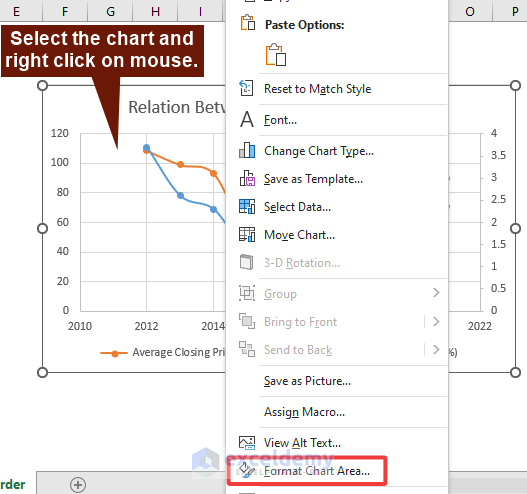
⦿ Step 1: Click on Chart and Select ‘Format Chart Area…’ Option
- Firstly, in order to remove the chart border, we will choose the chart of the Relationship Between Inflation and Oil Price >> right-click on the mouse, and then select Format Chart Area.
⦿ Step 2: Select ‘No Line’ Radio Button from Format Chart Area Pane
- Now in the Chart Options, go to Border >> No Line.
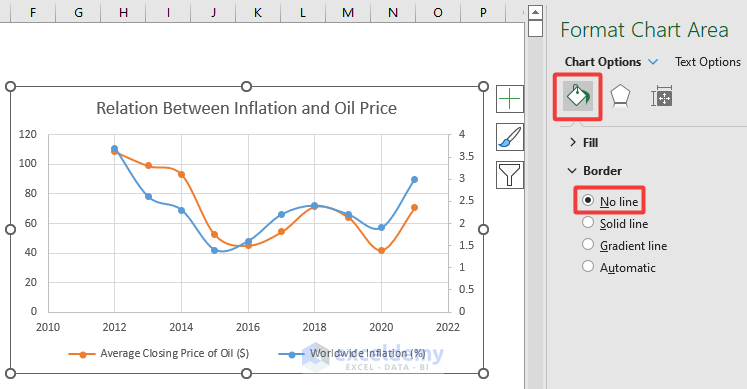
- Notice that the thin border line is no longer there.
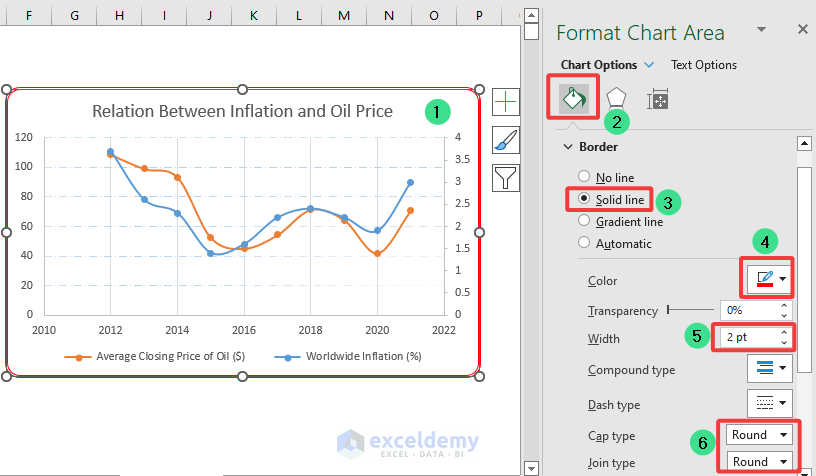
How to Change Chart Border in Excel
Now if changing borders may sometimes be a better option than No Border. In that case-
- Go to the Chart Option, and then go to Border >> Solid Line. Excel users may opt to change Border Color, Width, Cap Type, Join Type, and so on.
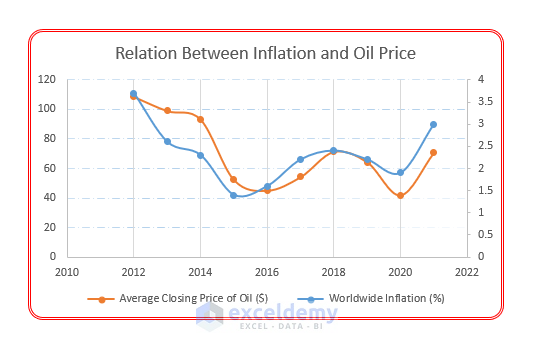
- After modifying according to the previous image, the chart will look like the following image.
Read More: How to Add Vertical Line in Excel Graph
Download Practice Workbook
You can download the practice workbook from the following download button.
Conclusion
Follow these steps and stages on how to remove a chart border in Excel. You are welcome to download the workbook and use it for your own practice. If you have any questions, concerns, or suggestions, please leave them in the comments section.
Related Articles
- How to Center a Chart in Excel
- How to Left Align a Chart in Excel
- How to Add a Vertical Dotted Line in Excel Graph
- How to Add Arrow in Excel Graph
- How to Add Asterisk in Excel Graph
<< Go Back to Formatting Chart in Excel | Excel Charts | Learn Excel
Get FREE Advanced Excel Exercises with Solutions!
