Exponential Moving Average is widely used for forecasting future data and smoothening stock price movement. If you want to know what an exponential moving average is and how you can calculate this in Excel, this is the right place for you. In this article, I’ll show you 3 suitable methods to calculate the Exponential Moving Average in Excel.
Exponential Moving Average in Excel (EMA)
The Exponential Moving Average (EMA), also known as the exponentially weighted moving average, is a kind of moving average that gives more weight to recent data than the simple moving average. Therefore smoothening in the case of the exponential moving average in Excel is higher than that of the simple moving average. The importance of the most recent data decreases as the time period lengthens. The formula for calculating EMA is,
EMAt = α xYt-1 + (1-α) x EMAt-1
Where, EMAt = Exponential moving average of current period
α = Smoothing multiplier. α can be any number between 0 to 1. The more the value of alpha, the more weight is given to the past data. The ideal range of α lies between 0.1 to 0.3. α can also be calculated by the following formula, α = 2/(n+1) ; here, n is the number of periods.
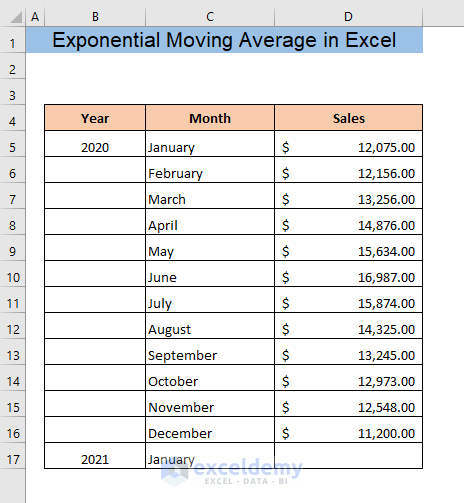
Suppose, we have the following dataset where we have sales data of 12 months in 2020. Now we want to forecast the sales data for January 2021 using Exponential Moving average.
1. Using Data Analysis Toolpak to Calculate Exponential Moving Average in Excel
We can apply the Exponential moving average to forecast future data by using the Data Analysis ToolPak. For that, first, you have to add this ToolPak to your Excel.
➤ Go to the File tab and select Options.

It will open the Excel Options window. Now,
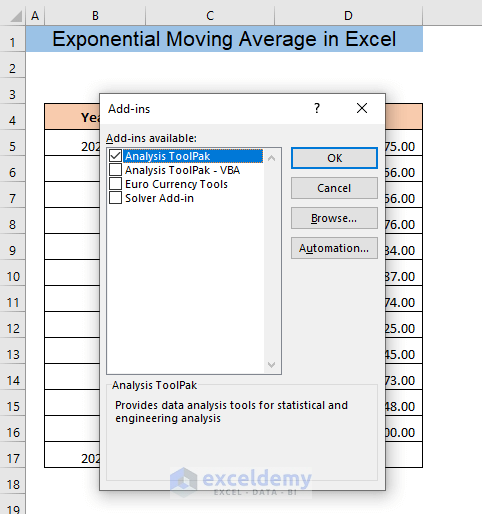
➤ Go to the Add-ins tab and click on Go button.
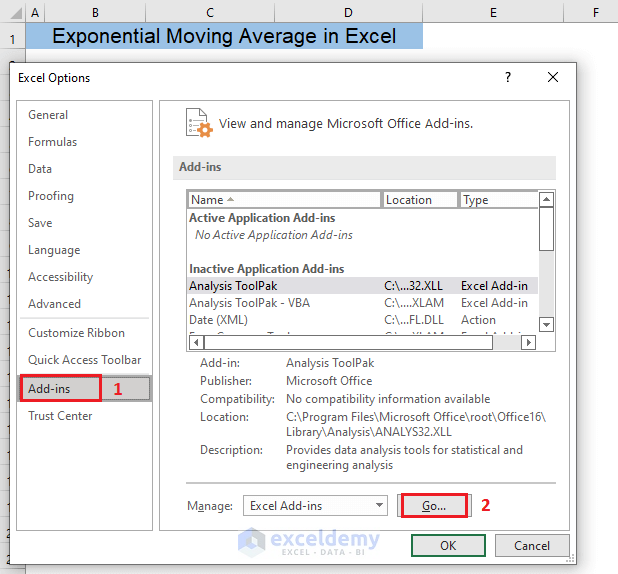
It will open the Add-ins box.
➤ Check on Analysis ToolPak and click on OK.
Now,
➤ Go to the Data tab and click on Data Analysis.
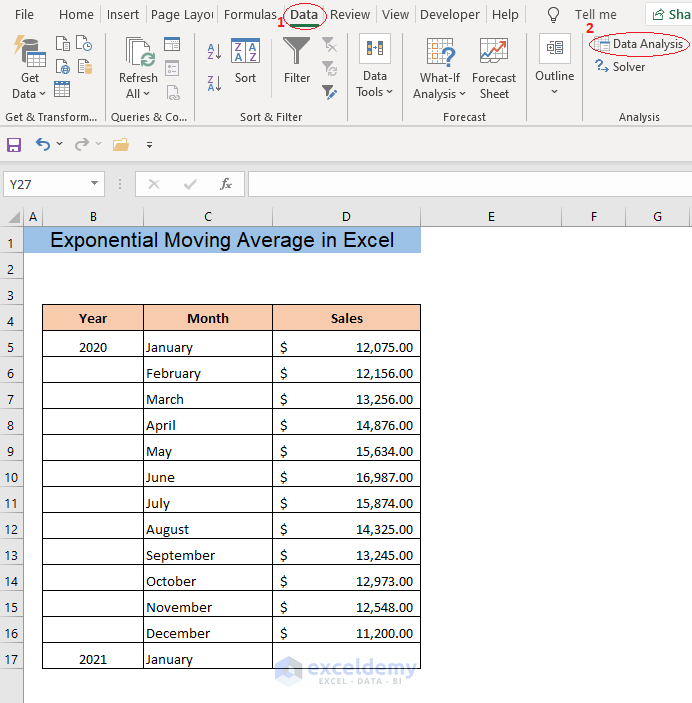
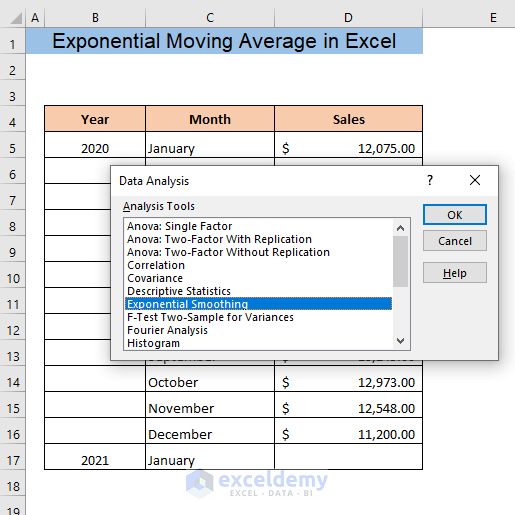
It will open the Data Analysis window.
➤ Select Exponential Smoothing and click on OK.
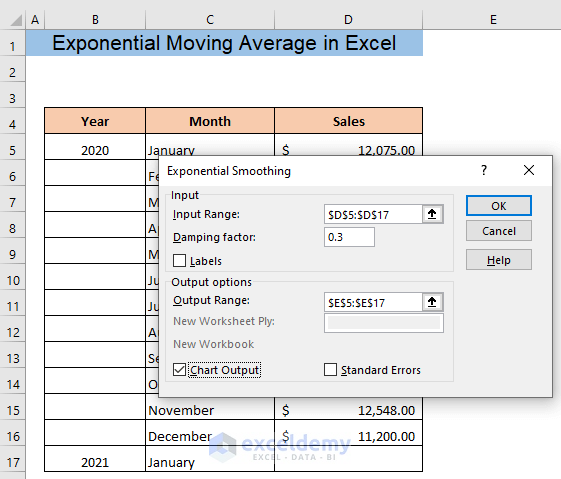
Now, in the Exponential Smoothing window,
➤ Select the cells with sales data in the Input Range box ( including the empty cell of the forecast period). Insert the value of α in the box Damping factor.
For this example, we have taken α as 0.3.
After that,
➤ Select the Output Range (where you want your EMA calculation).
If you want to see the graphical representation of the EMA and actual data,
➤ Check the box Chart Output.
At last,
➤ Click on OK.
As a result, Excel will give the EMA of your data in your selected sales and you will get the forecast of sales for January 2021.
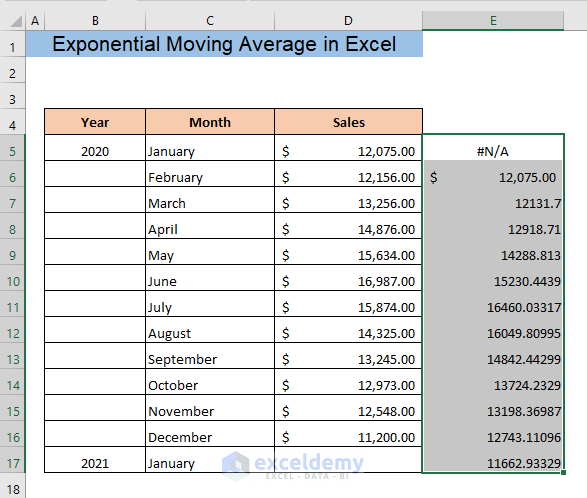
If you observe, you will see that the EMA for February is the same as the sales for January. Excel Analysis ToolPak simply assumes that the first EMA equals the previous period’s data which is also known as the Naive Method for forecasting.
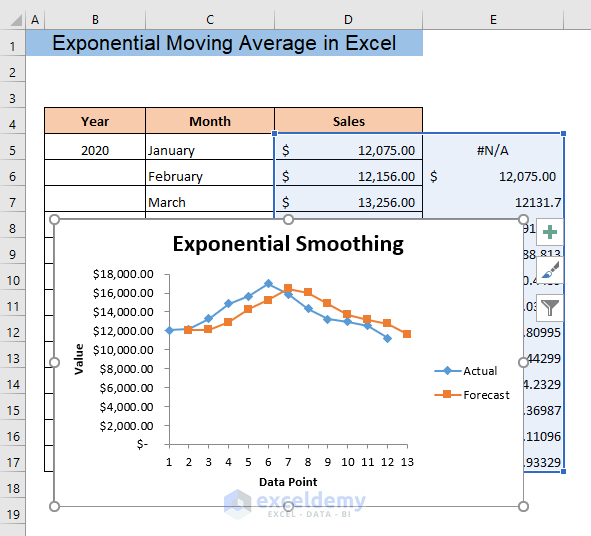
Excel will also show a chart comparing the Actual Data and Calculated EMA forecast.
Read More: How to Determine Triple Exponential Moving Average in Excel
2. Calculating Exponential Moving Average in Excel (Manual Method)
Instead of using the Analysis ToolPak, we can calculate the Exponential Moving Average by manually inserting the formula for EMA calculation. To calculate EMA for all the periods we need to know the EMA for the first period. We can calculate this using various methods such as naive, simple moving average, 3-period moving average, etc. In this example, we will use the 3-period moving average method (3MA).
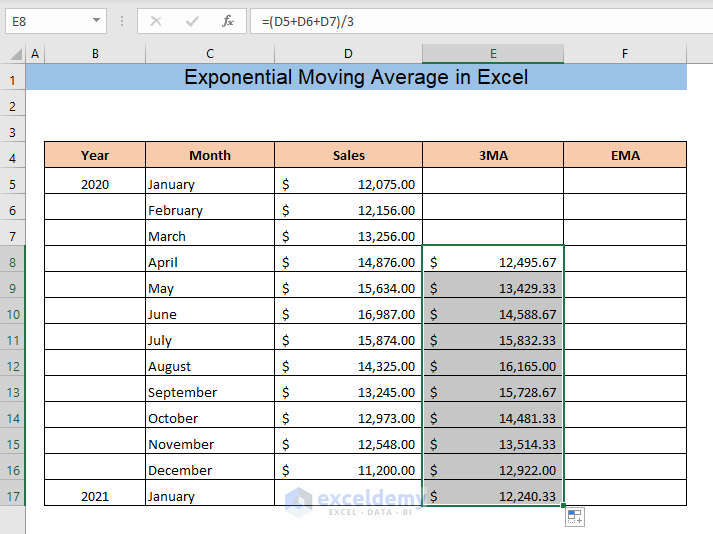
To calculate the 3-period moving average,
➤ Type the following formula in the row of April month (cell E8),
=(D5+D6+D7)/3The formula will return the average of the previous three year’s sales. After that,
➤ Drag cell E8 to get the 3MA for all the periods.
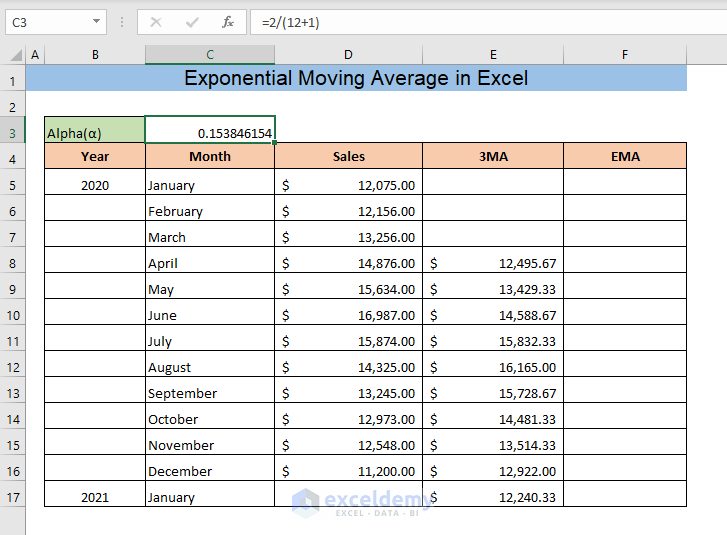
Now, we will need α to calculate the EMA. At this time we will determine α using the following formula,
=2/(12+1)We have taken n=12 as we have 12 periods in our dataset.
After that,
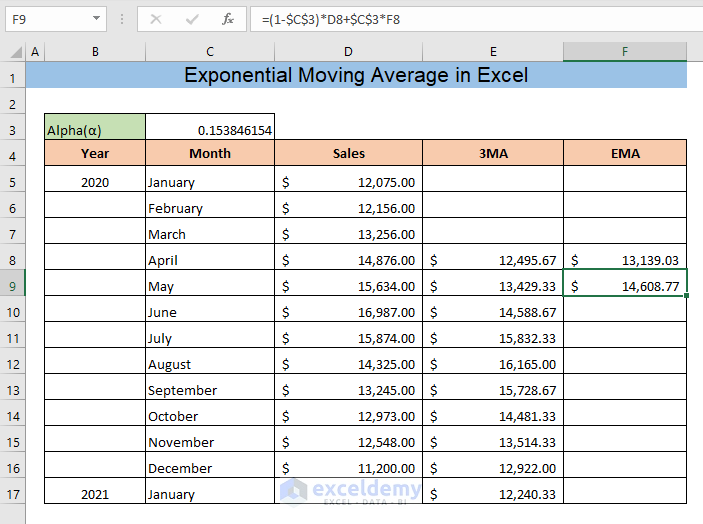
➤ Insert the following formula to determine EMA for the fourth period,
=(1-$C$3)*D7+$C$3*E8The formula will give the EMA for the first period where we have used this period’s 3MA as the previous period’s EMA.

Now, we have the EMA for the first year, so we can easily calculate the EMA for all of the periods.
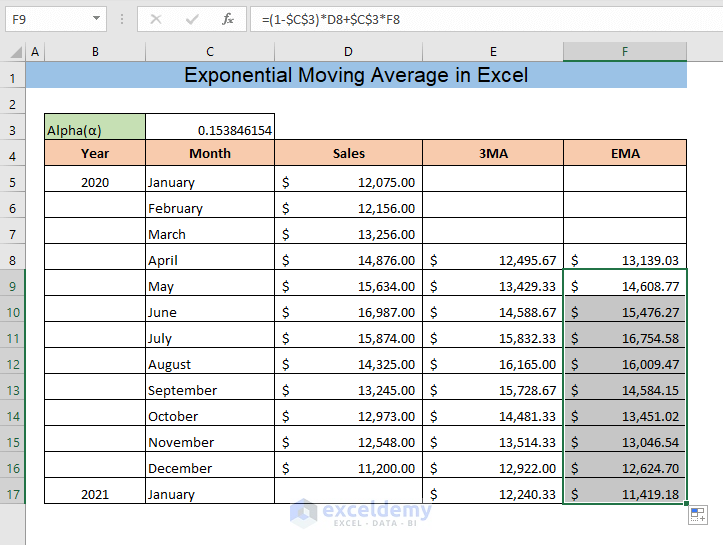
➤ Type the following formula in cell F9,
=(1-$C$3)*D8+$C$3*F8Here, $C$3 contains the value of α, D8 is the previous period’s sale and F8 is the previous period’s EMA.
At last,
➤ Drag cell E9 to the end of your dataset.
As a result, you will get the EMA for all of the periods including the forecast period (January 2021)
Read More: Calculate Moving Average for Dynamic Range in Excel
3. Applying VBA to Calculate Exponential Moving Average in Excel
Exponential Moving Average is also used to smoothen stock price movement. In this method, we will see how we can use the Exponential Moving Average to smoothen the stock price movement over multiple periods by making a custom function using the Microsoft Visual Basic Application (VBA).
In the time of smoothening stock price movement, the current period price is used in place of the previous period’s data in the EMA calculation formula. So the formula becomes,
EMAt = α x P + (1-α) x EMAt-1
Here, P is the current period price.
The formula can also be written in this way,
EMAt = α x P+ (1 – α) x EMAt-1
Suppose, at this time in our dataset, we have the average price of a stock over different months of a year. Now, we will build a custom formula using VBA to calculate the exponential moving average of the stock price in different months.
➤ First, right-click on the sheet name and select View Code.
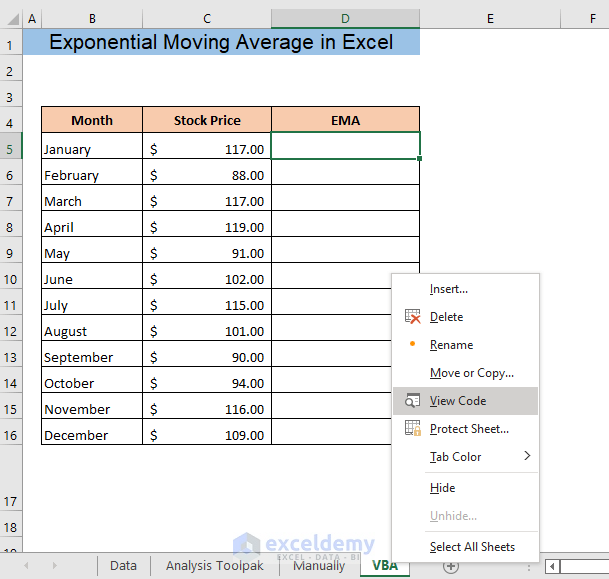
It will open the VBA Code window.
➤ Type the following code in this window,
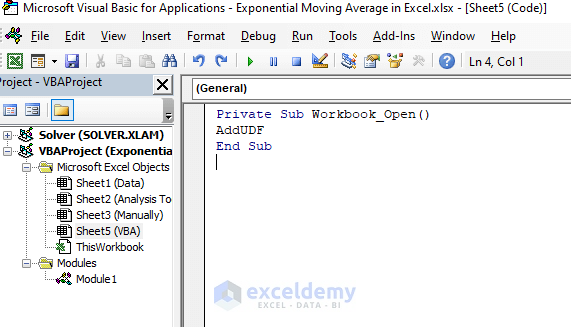
Private Sub Workbook_Open()

AddUDF

End Sub
The code will create a Macro which will add a custom code to this sheet of the Excel Workbook.
After that,
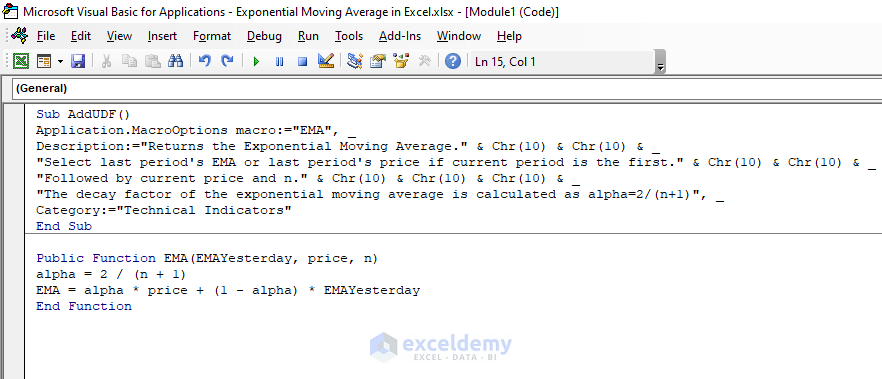
➤ Right-click on the sheet name from the left panel of the VBA window and go to Insert > Module.

It will open the VBA Module window. Now,
➤ Insert the following code in the Module window,
Sub AddUDF()

Application.MacroOptions macro:="EMA", _
Description:="Returns the Exponential Moving Average." & Chr(10) & Chr(10) & _
"Select last period's EMA or last period's price if current period is the first." & Chr(10) & Chr(10) & _
"Followed by current price and n." & Chr(10) & Chr(10) & Chr(10) & _
"The decay factor of the exponential moving average is calculated as alpha=2/(n+1)", _
Category:="Technical Indicators"

End Sub

Public Function EMA(EMAYesterday, price, n)

alpha = 2 / (n + 1)
EMA = alpha * price + (1 - alpha) * EMAYesterday

End Function
The code will create a custom function named EMA (EMAYesterday, price, n)
Now,
➤ Close the VBA window.
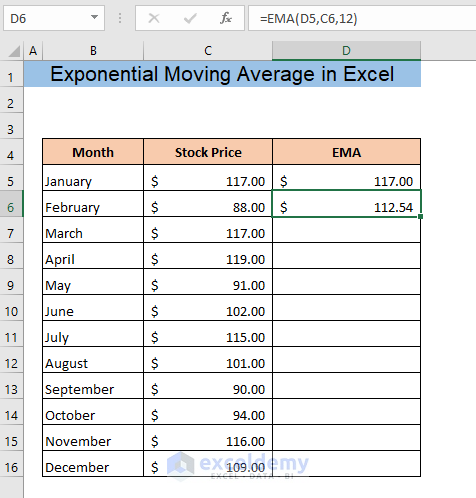
Now, to calculate EMA using this custom function we need to know the EMA of the first period.
In this example, we will use the naive method. So, the EMA of the first period will be equal to the stock price of this period.
After that,
➤ Insert the formula in cell D6,
=EMA(D5,C6,12)Here, D5 is the previous period’s EMA, C6 is the current period’s price and 12 is the number of periods.
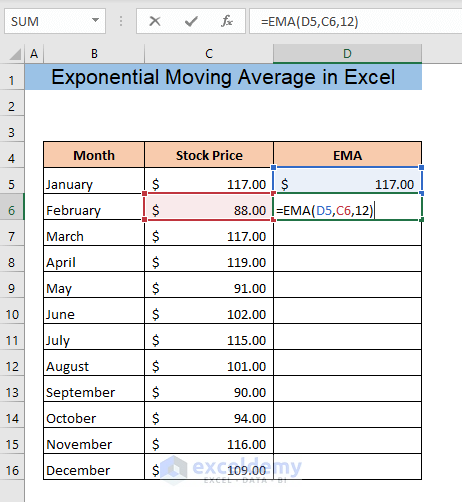
➤ Press ENTER.
As a result, you will get the EMA for that period.
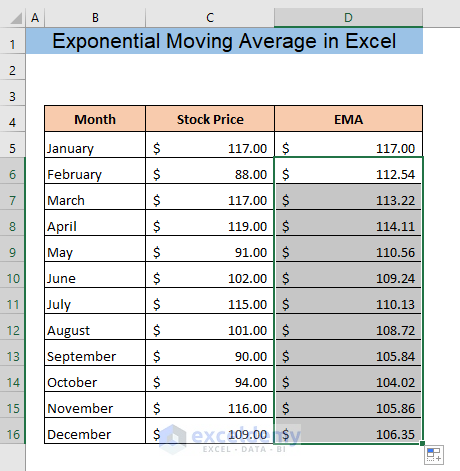
Now,
➤ Drag cell D6 to the end of your dataset.
As a result, you will get the EMA for all of the periods.
Read More: How to Calculate Centered Moving Average in Excel
Download Practice Workbook
Conclusion
I hope now you know how to calculate the exponential moving average in Excel. If you have any kind of confusion, please feel free to leave a comment.
Related Articles
- How to Generate Moving Average in Excel Chart
- How to Calculate 7 Day Moving Average in Excel
- Excel Formula to Find Displaced Moving Average
- How to Calculate Running Average in Excel
<< Go Back to Moving Average | Calculate Average in Excel | How to Calculate in Excel | Learn Excel
Get FREE Advanced Excel Exercises with Solutions!
