In this article, I will discuss the details of the Displaced Moving Average (DMA) formula in Excel. DMA is a variation of the Simple Moving Average (SMA). So, to get a broader perspective, before working with Displaced Moving Averages, we have to understand SMA. Basically, the Simple Moving Average (SMA) is the series of averages for the different groups of the same data range. Sometimes, we name SMA as rolling or running average too. For example, I have a dataset containing yearly average temperatures. So, I will first calculate the SMA t and then explain the Displaced Moving Average.
What is Displaced Moving Average?
Displaced Moving Average (DMA) is a Simple Moving Average that is adjusted forward or back in time to get a better forecast trend. DMA can be positive or negative. Positive displaced average means all the averages are shifted forward in time, Similarly, negative displacement indicates all the average values are shifted back in time. This moving average technique is widely used in stock market/bank and weather data analysis. Besides DMAs are useful in case of trend following purposes, compared to SMAs.
Displaced Moving Average Using Formula in Excel: with Easy Steps
Earlier in this article, we mentioned before finding the Displaced Moving Average we have to calculate SMA using an Excel formula.
Step-1: Dataset Introduction
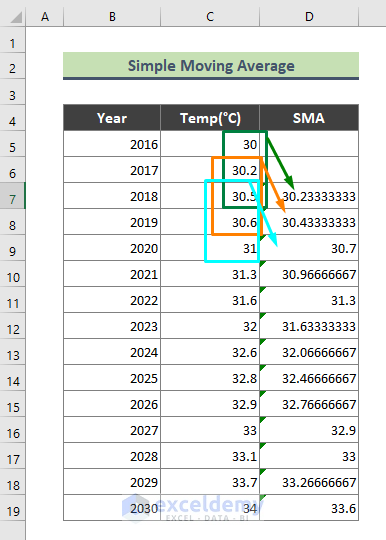
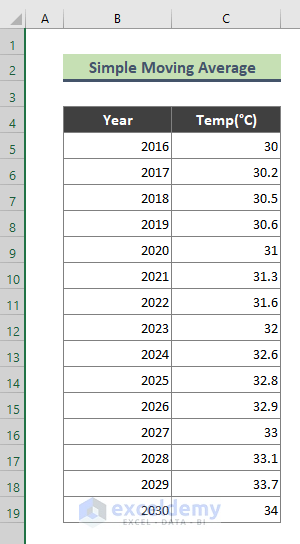
Suppose I have a dataset containing average temperature data year-wise. Now I will calculate the 3-year Moving Average temperature using the AVERAGE function in Excel.
Read More: How to Calculate Exponential Moving Average in Excel
Step-2: Apply Formula
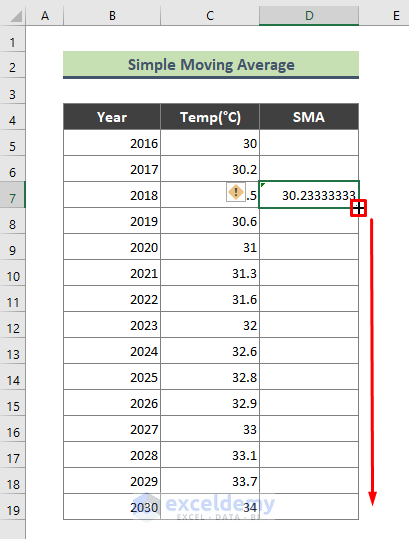
- First, type the below formula in Cell C7.
=AVERAGE(C5:C7)
- Hit Enter. As a result, for the year 2016-2018, we will get below average. Use Autofill (+) to copy the formula to the rest of the cells.
- Then we will get the below output. Here, notice that the average formula is updated according to the data subsets (C6:C8, C7:C9, and so on).

Step-3: Insert Chart
Now I will show the moving average trendline in a chart. To do that, go to Insert > Recommended Charts from Excel Ribbon.
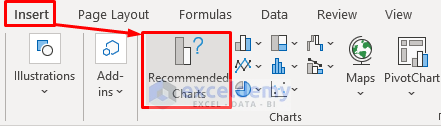
- Consequently, the Insert Chart window will show up. Choose the chart style from there and click OK.

- Finally, the chart along with the moving average trendline appeared.

Read More: Calculate Moving Average for Dynamic Range in Excel
Displaced Moving Average Formula in Excel
The formula for calculating the Displaced Moving Average is:
=DMA(period, shift_period)Here, the first argument specifies the period of a Simple Moving Average (such as 15 years), and the second argument specifies the shift period (for example: 5 years). In case you are calculating DMA back in time, type a negative number to shift the moving average back (Such as -5 years).
Usually, DMAs are termed as 10 DMA, 20 DMA, 50 DMA, etc. Such as, in our example, a 10 DMA means the yearly average temperature for the last 10 years. Similarly, a 50 DMA indicates the yearly average temperature for the last 50 years.
Read More: How to Calculate Running Average in Excel
Download Workbook
You can download the practice workbook that we have used to prepare this article.
Conclusion
In the above article, I have tried to discuss the idea of Displaced Moving Average and how to calculate it in Excel. Hopefully, the above explanation will be enough to solve your problems. Please let me know if you have any queries.
Related Articles
- How to Calculate 7-Day Moving Average in Excel
- How to Determine Triple Exponential Moving Average in Excel
- How to Calculate Centered Moving Average in Excel
- How to Generate Moving Average in Excel Chart
<< Go Back to Moving Average | Calculate Average in Excel | How to Calculate in Excel | Learn Excel
Get FREE Advanced Excel Exercises with Solutions!
