If you have a dataset that contains both negative and non-negative values and want to calculate the average of values that are greater than zero then Excel can be helpful for you. In this article, you will get to know how you can average values greater than zero in Excel.
How to Average Values Greater Than Zero in Excel: 4 Easy Ways
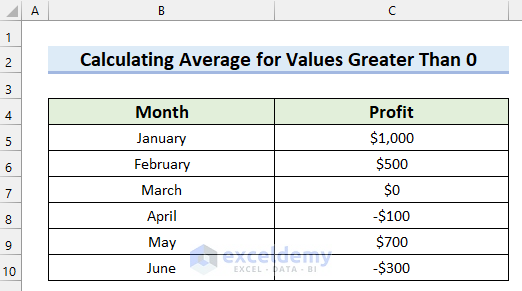
Here, I have taken the following dataset that contains the Month and Profit columns. The Profit column contains both positive and negative values. Here, the negative value means loss, and 0 means a breakeven point. I will show you how you can average values greater than zero in Excel by using this dataset. I will explain 4 easy and effective ways.
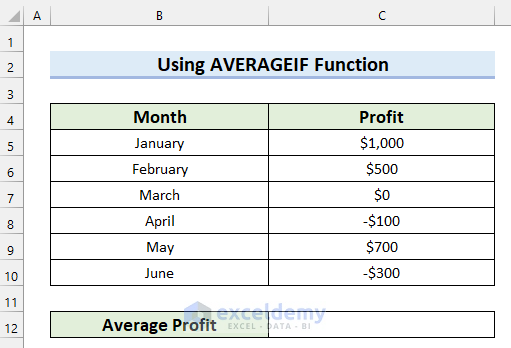
1. Using AVERAGEIF Function to Average Values Greater Than Zero in Excel
In this first method, I will explain how you can average values greater than zero by using the AVERAGEIF function. Suppose you have the following dataset that contains both positive and negative profits. Here, negative profits mean loss. And, you want to calculate the average profit which means the average of the values that are greater than zero.
Steps:
- Firstly, select the cell where you want to calculate the Average Profit. Here, I selected cell C12.
- In cell C12 write the following formula.
=AVERAGEIF(C5:C10,">0")
In the AVERAGEIF function, I selected C5:C10 as the range and ">0" as the criteria. The formula will return the average of the values from the range that match the criteria.
- Then, press ENTER and you will get your Average Profit.

Read More: How to Calculate Average in Excel Excluding 0
2. Applying AVERAGEIFS Function in Excel
Here, I will explain how you can average values greater than zero by applying the AVERAGEIFS function.
Steps:
- Select cell C12 to calculate average values greater than zero.
- Write the following formula in cell C12.
=AVERAGEIFS(C5:C10,C5:C10,">0")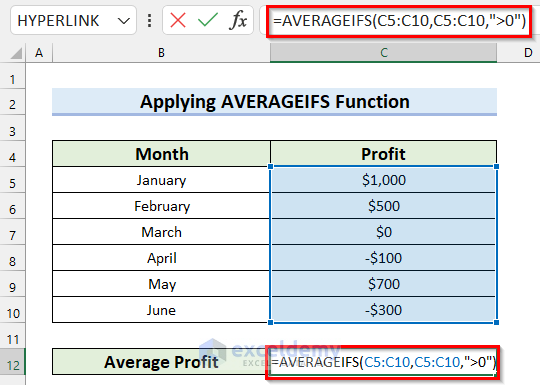
In the AVERAGEIFS function, I selected range C5:C10 as average_range. Then, I selected range C5:C10 as criteria_range1 and ">0" as criteria1. Now, the formula will return the average of the values from the average_range that match the criteria1.
- Finally, press ENTER to get the result.

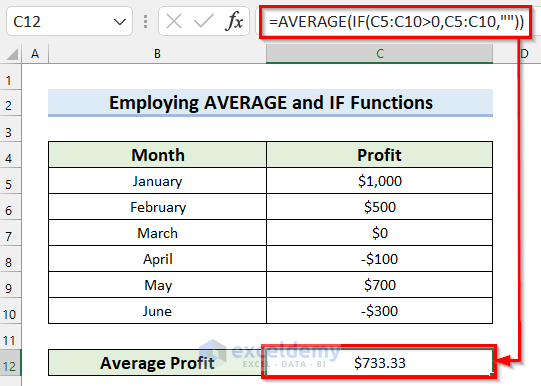
3. Employing AVERAGE and IF Functions
In this method, I will show you how you can average values greater than zero by employing AVERAGE and IF functions.
Steps:
- Firstly, select the cell where you want to calculate the Average Profit.
- In that selected cell write the following formula.
=AVERAGE(IF(C5:C10>0,C5:C10,""))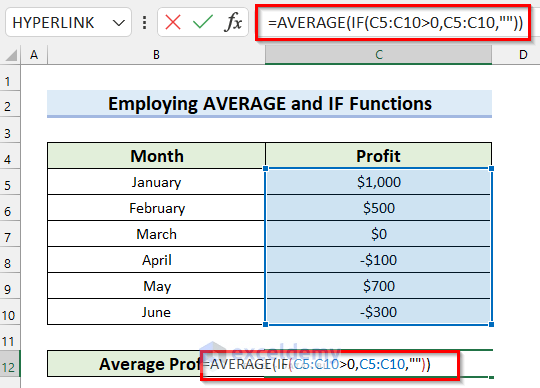
Formula Breakdown
- IF(C5:C10>0,C5:C10,””) —-> Here, the IF function will check if C5:C10>0. If the logical_test is True then the formula will return C5:C10. Otherwise, it will return a blank.
- Output: {1000;500;””;””;700;””}
- AVERAGE(IF(C5:C10>0,C5:C10,””)) —-> turns into
- AVERAGE({1000;500;””;””;700;””}) —-> Now, the AVERAGE function will return the average of the values.
- Output: 733.33333
- AVERAGE({1000;500;””;””;700;””}) —-> Now, the AVERAGE function will return the average of the values.
- Finally, press ENTER and you will get the Average Profit.
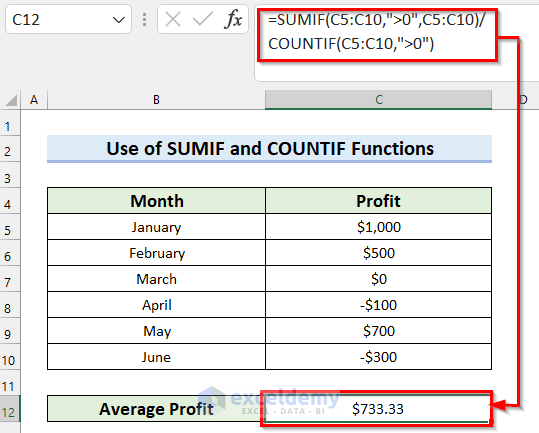
4. Use of SUMIF and COUNTIF Functions to Average Values Greater Than Zero
In this method, I will explain how you can use the SUMIF and COUNTIF functions to average values greater than zero in Excel.
Steps:
- Firstly, select cell C12 to calculate the Average Profit.
- Insert the following formula in cell C12.
=SUMIF(C5:C10,">0",C5:C10)/COUNTIF(C5:C10,">0")
Formula Breakdown
- SUMIF(C5:C10,”>0″, C5:C10) —-> Here, the SUMIF function will return the summation of the values that match the criteria.
- Output: 2200
- COUNTIF(C5:C10,”>0″) —-> Here, the COUNTIF function will count the number of cells that match the criteria.
- Output: 3
- SUMIF(C5:C10,”>0″,C5:C10)/COUNTIF(C5:C10,”>0″) —-> turns into
- 2200/3 —-> Now, the formula will divide 2200 by 3.
- Output: 733.33333
- 2200/3 —-> Now, the formula will divide 2200 by 3.
- Finally, press ENTER to get the Average Profit.
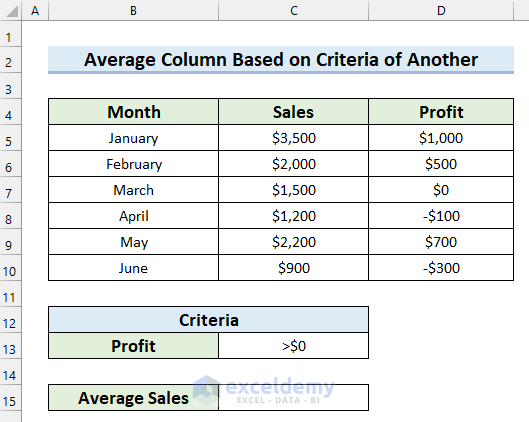
How to Average a Column Based on Criteria of Another Column in Excel
In this section, I will show you how to average a column based on the criteria of another column in Excel. Here, I have taken the following dataset to explain this example. This dataset contains the Month, Sales, and Profit columns. I will show you how you can calculate the Average Sales if the profit is greater than zero.
Steps:
- Select the cell where you want to calculate the Average Sales. Here, I selected cell C15.
- In cell C15 write the following formula.
=AVERAGEIF(D5:D10,">0",C5:C10)
In the AVERAGEIF function, I selected the range D5:D10 as the range and ">0" as the criteria. Then, I selected the range C5:C10 as average_range. Now, the formula will return the average of the values from average_range that match the criteria.
- After that, press ENTER to get the Average Sales.

Read More: Calculate the Average of an Array with VBA
Things to Remember
- You should keep in mind that if the AVERAGEIF function fails to meet the criteria then it will return #DIV/0! error.
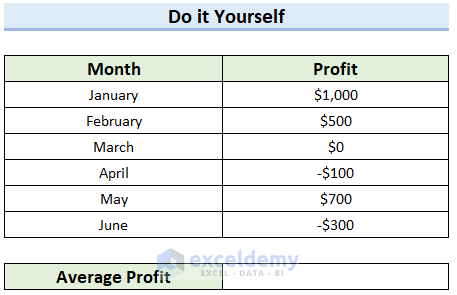
Practice Section
Here, I have provided a practice sheet for you to practice how you can get average values greater than zero in Excel.
Download Practice Workbook
Conclusion
To conclude, I tried to cover how you can average values greater than zero in Excel. Here, I explained 4 easy ways of doing it. I hope this article was helpful to you. Lastly, if you have any questions feel free to let me know in the comment section below.
Related Articles
- How to Calculate VLOOKUP AVERAGE in Excel
- How to Find Average with OFFSET Function in Excel
- How to Use VBA Average Function in Excel
- How to Add Average Line to Excel Chart
<< Go Back to Conditional Average | Calculate Average | How to Calculate in Excel | Learn Excel
Get FREE Advanced Excel Exercises with Solutions!
