Dataset Overview
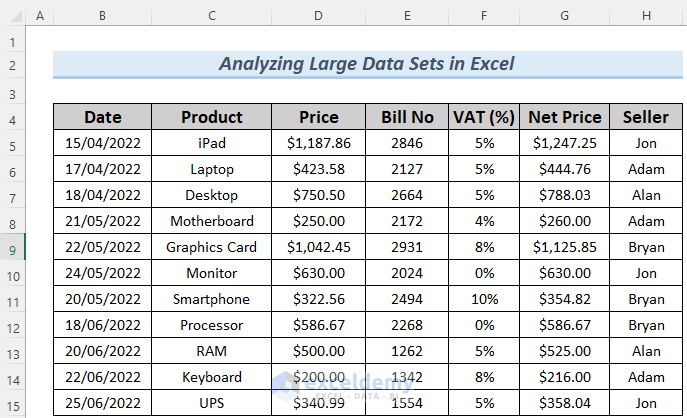
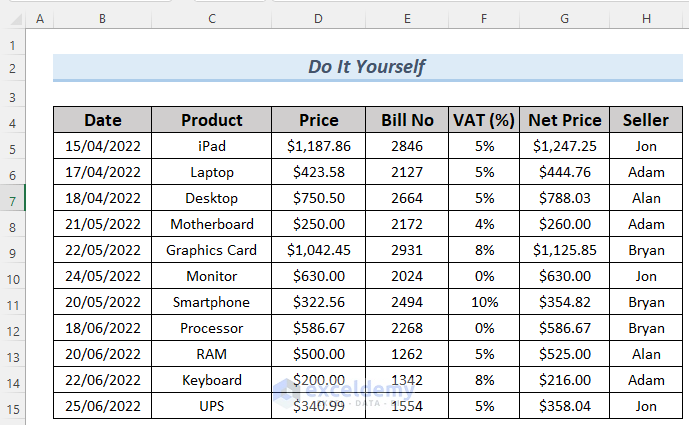
Let’s work with the sales information dataset for electronic devices. Although this dataset may not be large, we can still demonstrate examples of how to analyze and manipulate data using it.
When analyzing this dataset, using it in table format is convenient. To convert the data into a table:
- Select the dataset, navigate to Insert and select Table.
- A dialog box will appear; ensure you choose My table has headers.
- Click OK.
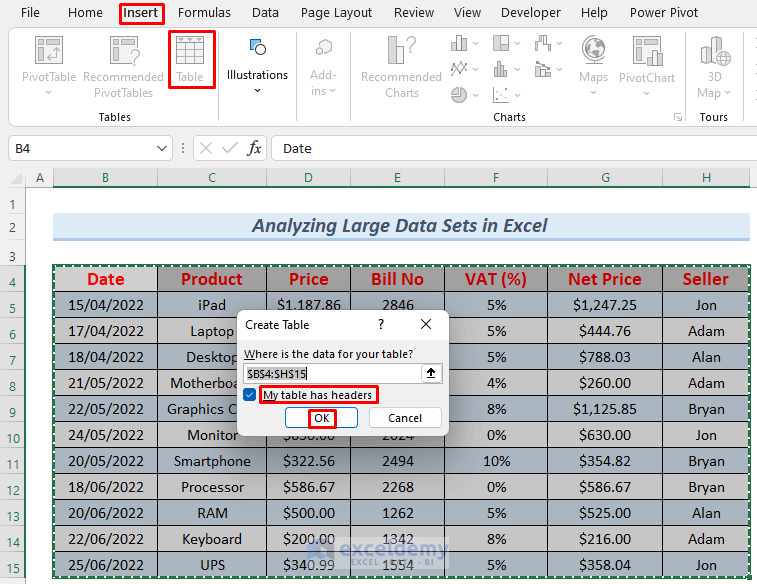
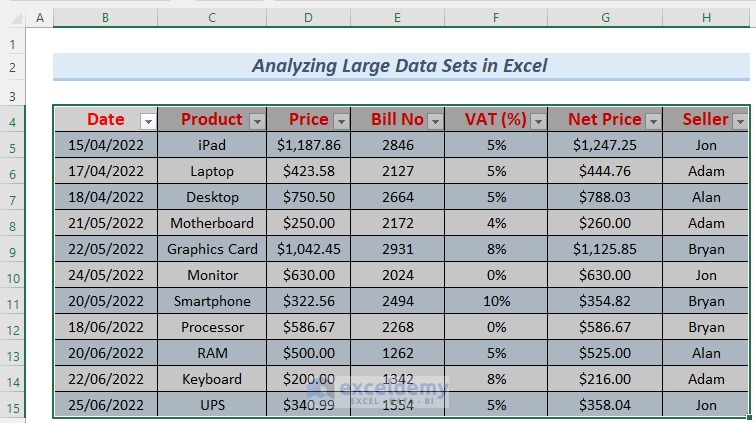
Executing this operation will convert your dataset into an Excel table.
Method 1 – Analyzing Large Data Sets with Pivot Table
Excel offers various methods to analyze large datasets, and one effective approach is utilizing Pivot Tables available under the Insert Tab. A Pivot Table facilitates the examination of product sales data through customizable columns and rows, enabling users to view data aggregated by months or years.
- Select the data table, navigate to Insert and select Pivot Table.
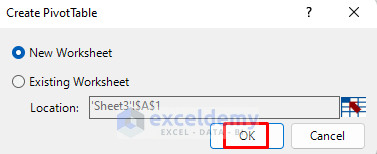
- A dialog box will appear, giving you the option to choose between a New Worksheet or Existing Worksheet, based on your preference.
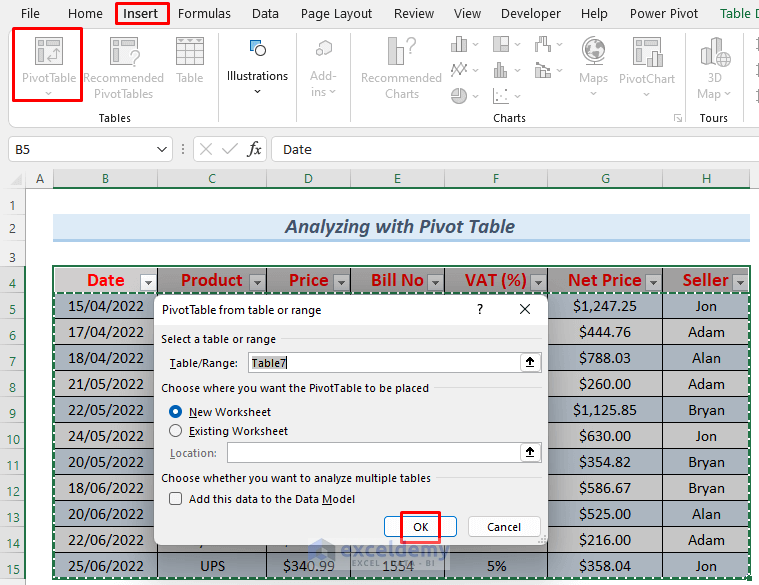
- Opting for a New Worksheet will generate the Pivot Table features in a fresh worksheet.
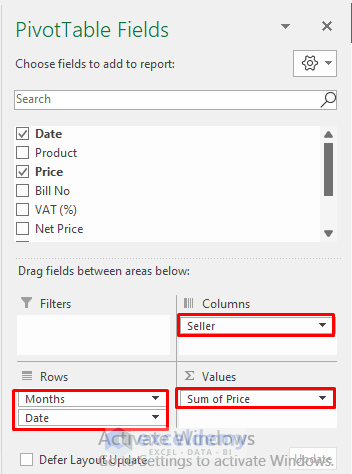
- Drag the relevant data ranges (such as Date, Price, Seller Name, etc.) into the Pivot Table Fields. This action will provide a summarized view of sales information within the Pivot Table.
- For instance, dragging the Date range into the Rows Field will automatically create a Month range, allowing observation of sales information on a monthly basis.
- Additionally, including Seller Name in the Columns Field can aid in identifying the top-performing employees for potential bonuses.
- By dragging the Price range into the Values Field, you can assess the total sales within the selected period.
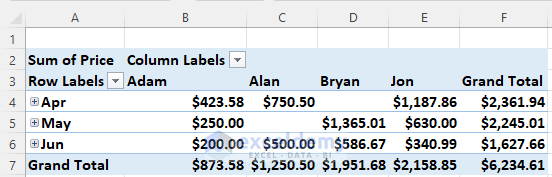
- Upon reviewing your Pivot Table, you will observe comprehensive information such as total sales by month, sales per seller, and the overall sales Grand Total.
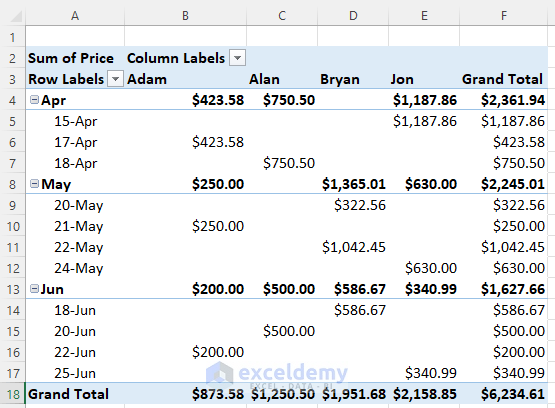
- For further granularity, you can explore data breakdowns by dates simply by clicking on the plus icon (+) adjacent to the Month Name.
Leveraging Pivot Tables proves invaluable for analyzing extensive datasets, particularly when dealing with routine sales information.
Read More: How to Analyze Raw Data in Excel
Method 2 – Analyzing Large Data Sets with the Filter Command
Another approach to analyzing extensive data sets in Excel involves using the Filter Command, which allows you to refine information based on specified criteria. Here are the steps:
- Select the dataset range, navigate to Home, select Sort & Filter and click on Filter.
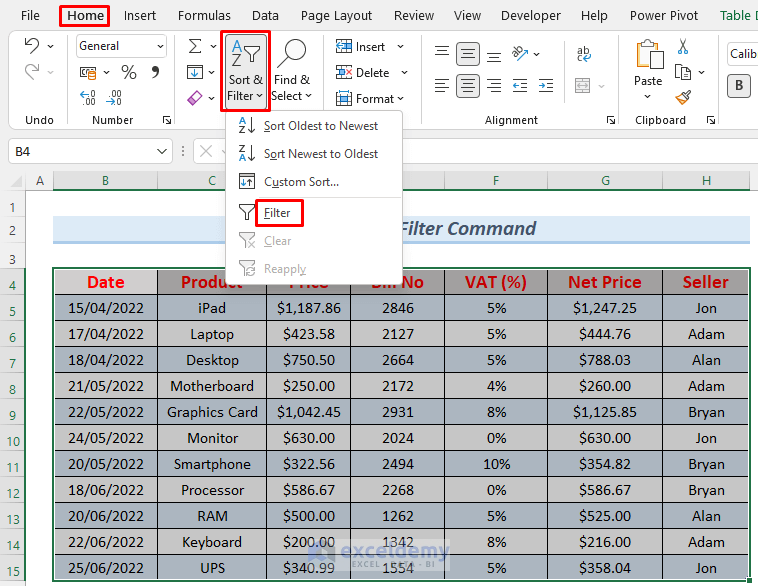
- The Filter Icon will appear in the headers.
- However, if you intend to view total sales inclusive of VAT while utilizing the Filter Command, you’ll need to use the following formula:
=SUBTOTAL(9,Table13[Net Price])
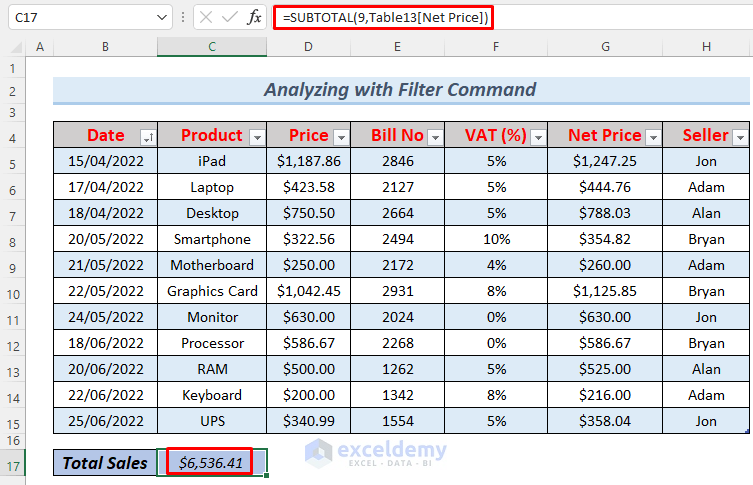
- This formula utilizes the SUBTOTAL function to calculate the total net sales of the filtered data.
- With the dataset filtered, you can customize it according to your preferences. For example, to filter by month, click the drop-down icon beside the Date header and select one or multiple months.
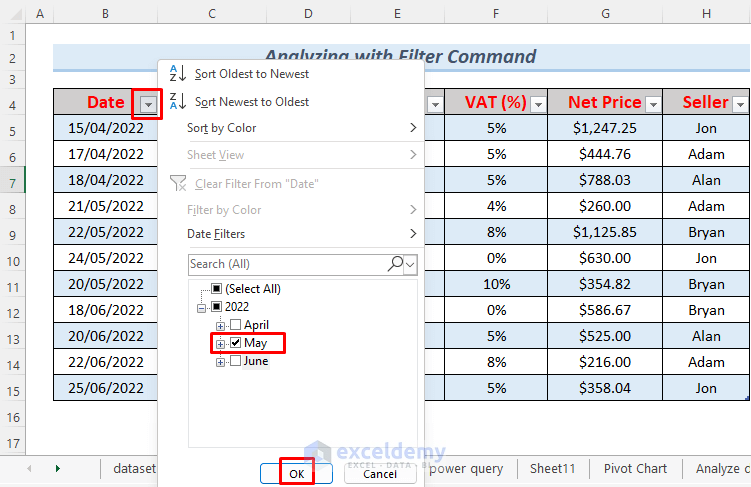
- After selecting May, and clicking OK, you’ll observe the sales information specific to that month, including the total sales with VAT.

- Similarly, if you wish to ascertain the sales attributed to an individual seller, simply select their name and click OK.
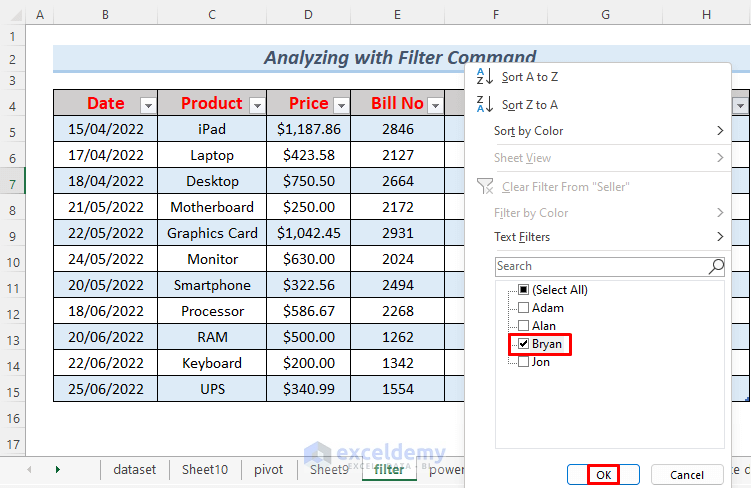
- The corresponding sales information will be displayed in the Excel sheet.
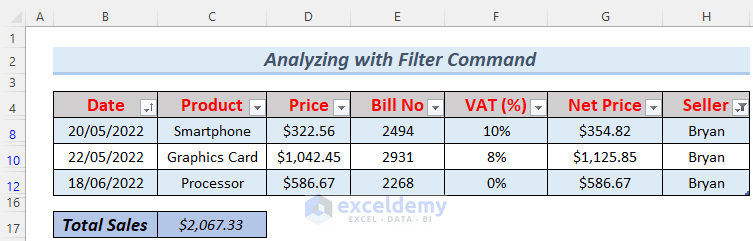
Leveraging the Filter Command enables effective analysis of large data sets by allowing for tailored filtering based on specific criteria
Method 3 – Utilizing Excel Power Query Editor for Analysis
The Excel Power Query Editor proves invaluable for analyzing large datasets. Below, we outline the process:
- Select your data table, navigate to Data and select From Table/Range.
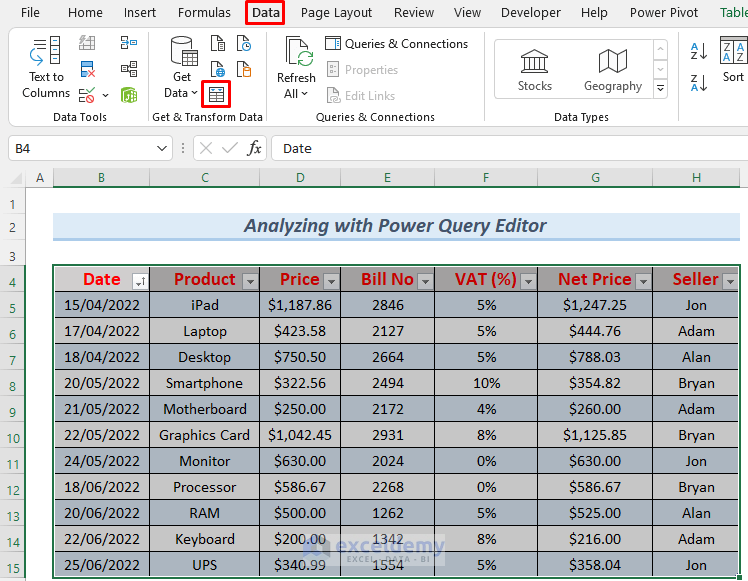
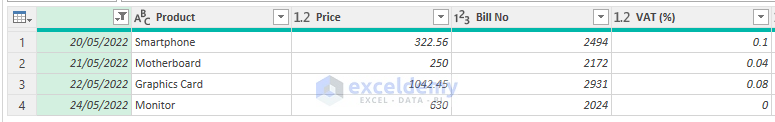
- Your dataset will then appear in the Power Query Editor, equipped with filtering capabilities to summarize or isolate specific sales or employee records.
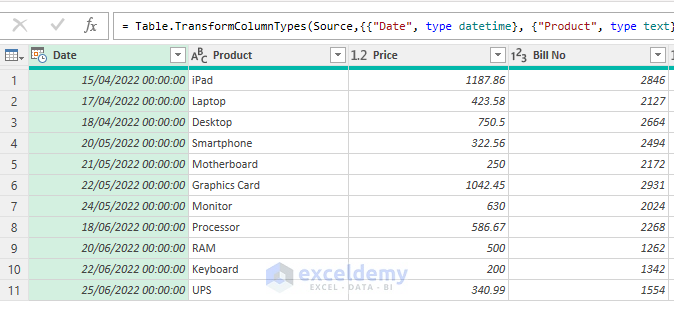
- While not mandatory, it’s advantageous to remove the time component from the dates in the Date column. This can be easily achieved by navigating to the Transform Tab of the Power Query Editor, selecting Date and clicking on Date Only.
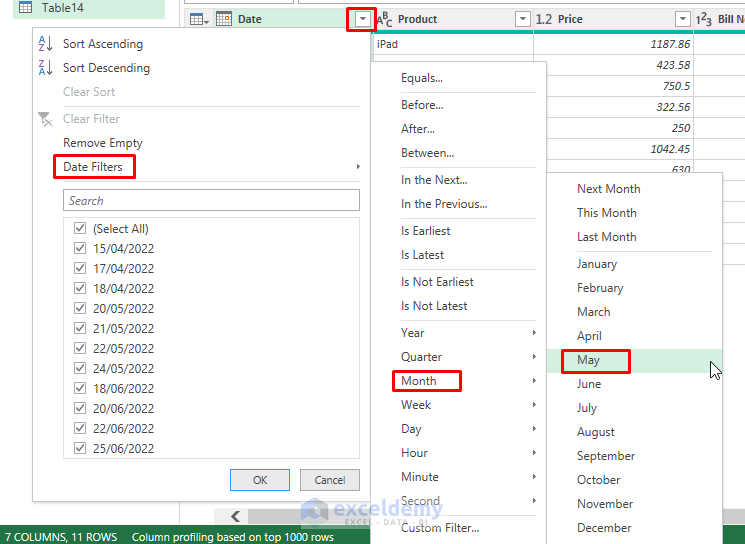
- Utilize the drop-down icon to filter your dates, opting to filter by individual dates or months.
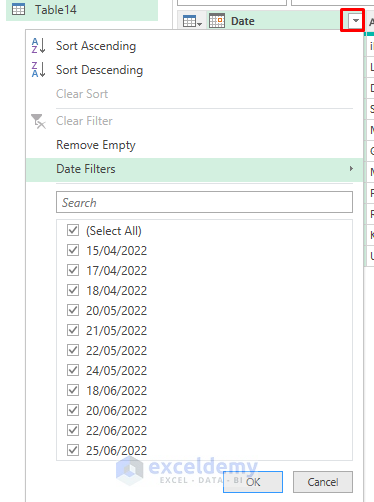
- For instance, selecting May provides insights into sales for that specific month. Alternatively, you can employ the Custom Filter option to filter for sales records spanning multiple months or periods.
- The sales data for May will be displayed.
- To load this filtered data into an Excel sheet, click on Close & Load.
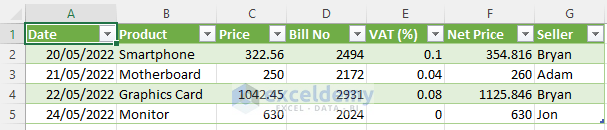
- The sales records for May will be presented as a table in a new sheet.
- You can further refine your analysis by filtering based on Seller Names or Price Ranges in the Power Query Editor and subsequently loading them into a new sheet using the same procedure.
Method 4 – Analyzing Large Data with Pivot Charts
Utilizing Pivot Charts proves to be an effective method for analyzing data through visual representations.
- Follow the steps outlined in Section 1 to create a Pivot Table.
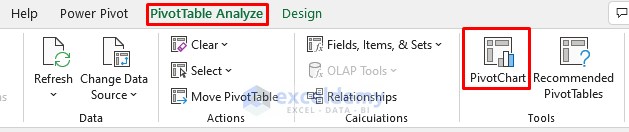
- Once the Pivot Table is established, navigate to PivotTable Analyze and select PivotChart within the Pivot Table sheet.
- Ensure you select any cell within the Pivot Table before proceeding.
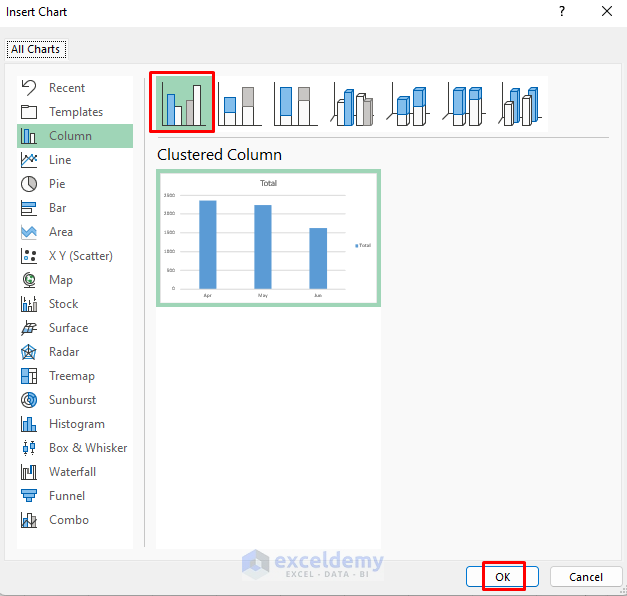
- A range of options for the Pivot Chart will be presented. Choose your preferred chart type and click OK.
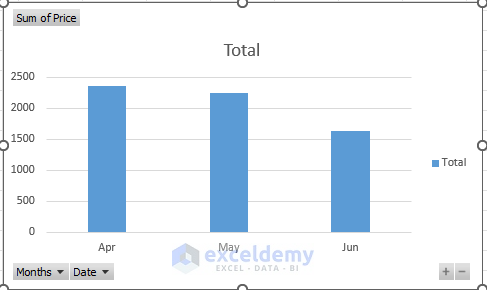
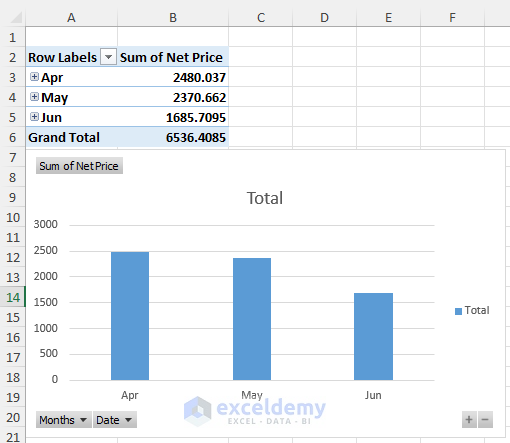
- The Pivot Chart will then display the monthly total sales.
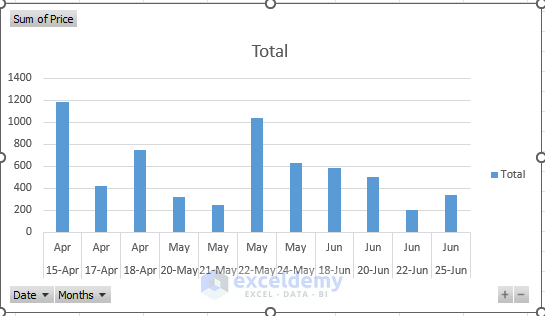
- If you wish to visualize sales by dates, simply drag the Date range above the Month range in the Pivot Table Fields.
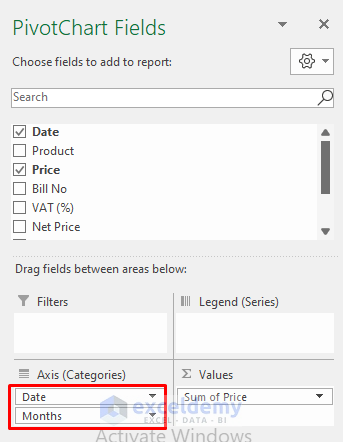
- This action will update the chart to depict sales data by dates.
By leveraging Pivot Charts, you can effectively analyze large datasets. Particularly beneficial for visualizing yearly sales or extensive transaction records, Pivot Charts offer enhanced data visualization capabilities for improved insights.
Read More: How to Analyze Text Data in Excel
Method 5 – Utilizing Power Pivot for Analyzing Large Data Sets
Another method for conducting Pivot Table analysis on large datasets is by leveraging the Power Pivot feature.
- Close the current workbook and open a new one.
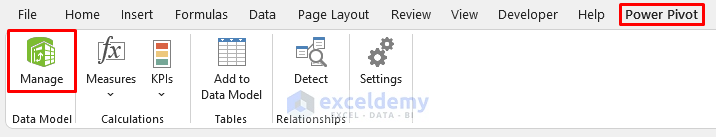
- Navigate to Power Pivot and click on Manage.
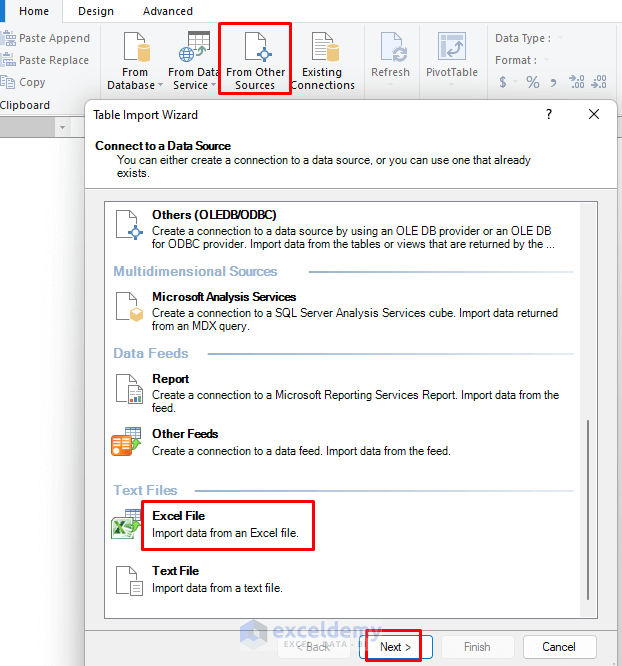
- In the Power Pivot window, select Home and click on From Other Sources.
- The Table Import Wizard will appear.
- Choose Excel File and click Next.
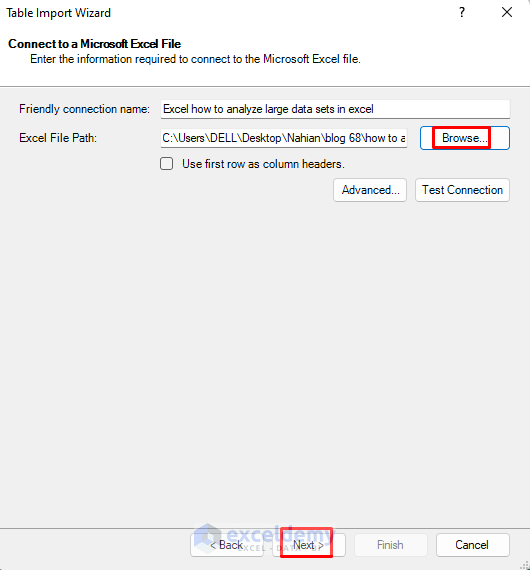
- Browse your Excel Workbook containing the dataset.
- Click Next.
- Select the Power Pivot sheet of the workbook and click Finish.
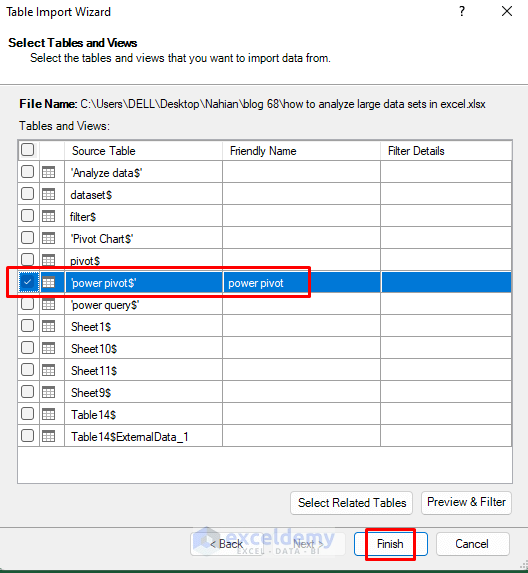
- Click Close.
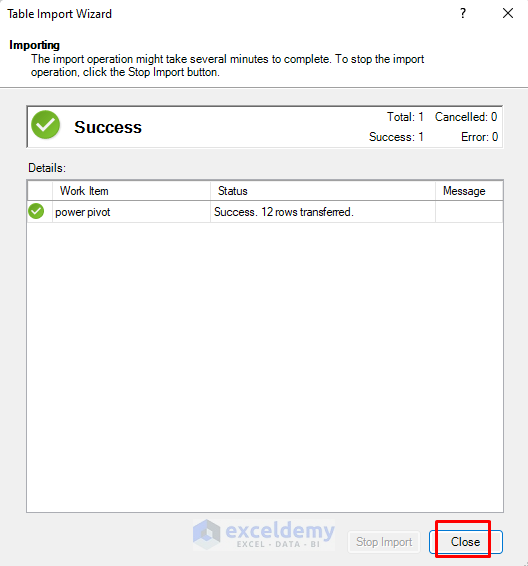
- This operation will upload the dataset from the selected sheet as a table in Power Pivot.
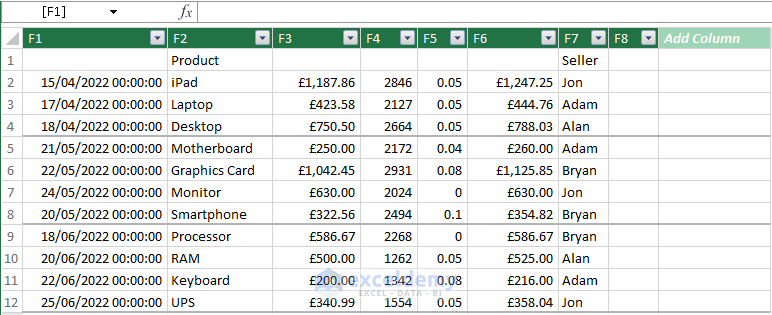
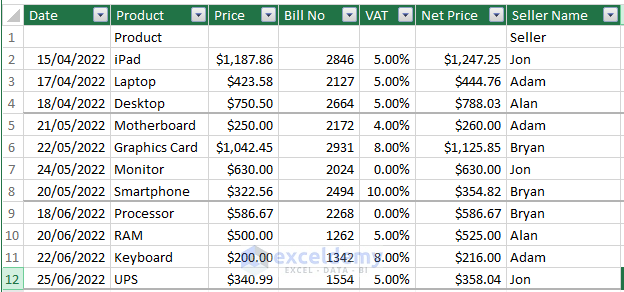
- Rename the column headers by right-clicking and selecting Rename Column from the Context Menu.
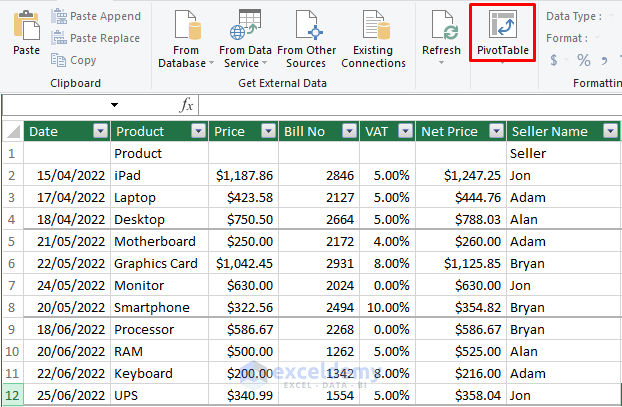
- To perform Pivot Table analysis, select the Pivot Table.
- A dialog box will appear.
- Choose whether you want the Pivot Table in the Existing Worksheet or a New Worksheet and click OK.
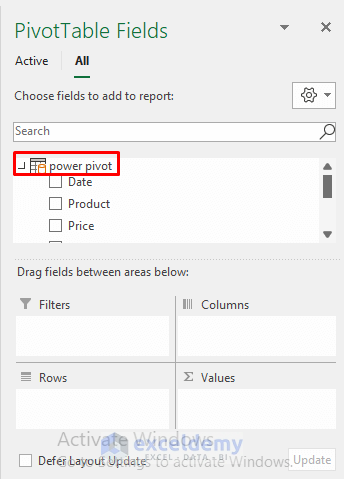
- You will now see the Pivot Table Fields in a new sheet.
- Select Power Pivot to view all the ranges it contains, such as Date, Price, VAT, etc.
- Follow the instructions provided in Section 1 to analyze the data using a Pivot Table.
- If you wish to visualize monthly sales information using a chart, refer to the instructions in Section 4 on how to analyze data with a Pivot Chart.
Method 6 – Utilizing the Analyze Data Feature
To streamline data analysis within a single sheet, consider employing the Analyze Data feature from the Data Tab. This approach can significantly save you time.
- Select your table and choose Analyze Data.
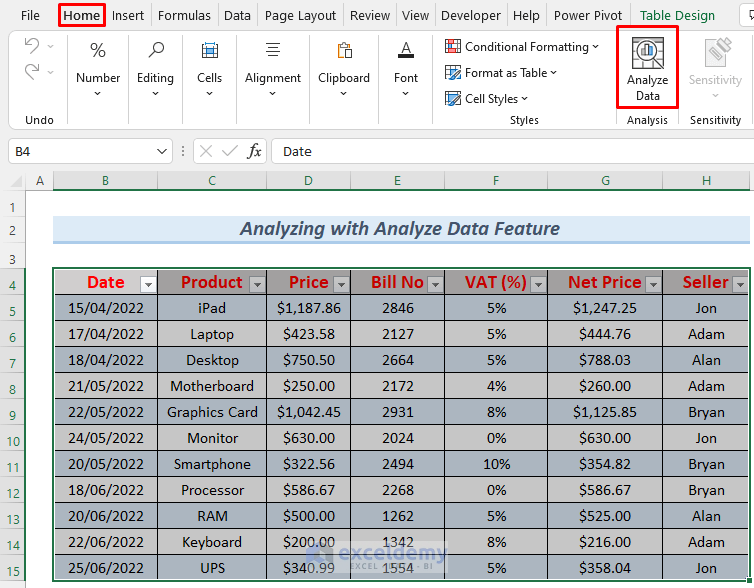
- The Analyze Data window will appear on the right side of your Excel sheet.
- Scroll down to explore the various options available for data analysis. Among them, you’ll find the option for Pivot Table analysis.
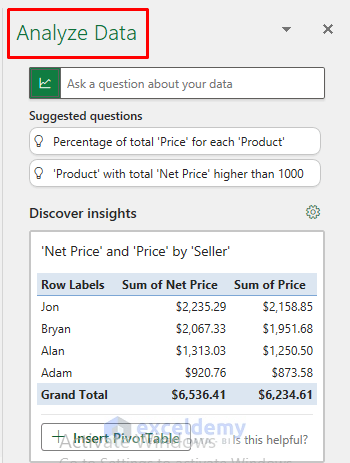
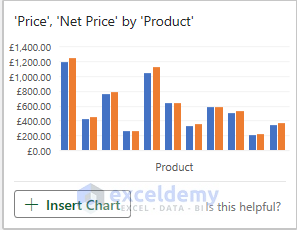
- As illustrated in the accompanying image, there’s an option for Bar Chart analysis, allowing for comparison of Price and Net Price of products.
- Let’s select the Net Price by Product chart to demonstrate the analysis.
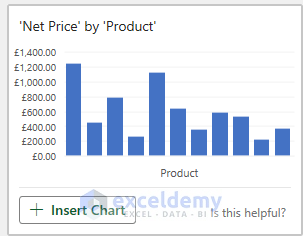
- This action will generate a bar chart analysis depicting the variation of Net Price by Products.
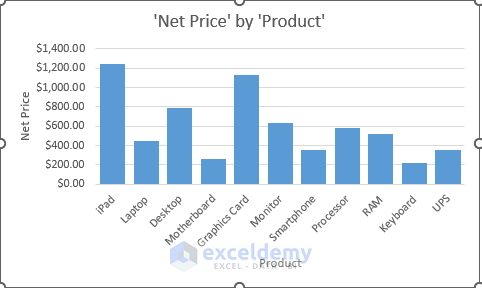
- Further options can be found by continuing to scroll down. Choose any that suit your needs and proceed with the analysis.
Leveraging the Analyze Data feature enables efficient analysis of large datasets within a unified interface, offering a range of analytical tools to explore and derive insights.
Read More: How to Analyze Time Series Data in Excel
Practice Section
Here, I’m providing you with the dataset from this article so you can practice these methods independently.
Download Practice Workbook
You can download the practice workbook from here:
Related Articles
- How to Analyze Sales Data in Excel
- How to Analyze Likert Scale Data in Excel
- How to Analyze qPCR Data in Excel
- How to Analyze Quantitative Data in Excel
- How to Analyze Qualitative Data in Excel
- How to Analyse Qualitative Data from a Questionnaire in Excel
- How to Convert Qualitative Data to Quantitative Data in Excel
<< Go Back to Data Analysis with Excel | Learn Excel
Get FREE Advanced Excel Exercises with Solutions!

It is unclear to me why you would choose one method over another; in what cases and with what differentiating benefits would you use PowerQuery, PivotCharts, PowerPivot, and AnalyzeData?
Hello Rulande,
Thank you for your thoughtful question! Choosing between Power Query, PivotCharts, Power Pivot, and Analyze Data depends on the task, dataset size, and the level of automation or analysis needed. Here’s a quick breakdown:
Power Query: Ideal for data cleaning, transformation, and merging from multiple sources. Best used when you’re preparing large or messy datasets for analysis.
PivotCharts: Great for visualizing summarized data from PivotTables. Use this when you want interactive visuals that update as your data changes.
Power Pivot: Useful for handling very large datasets and performing advanced calculations using DAX formulas. It supports creating data models and relationships across multiple tables.
Analyze Data: Best for quick insights and summaries using AI. It’s helpful when you need fast trend detection or anomaly identification without deep manual effort.
Each tool serves a unique purpose, and in practice, they often complement each other. Let me know if you’d like an example workflow using a combination of these!
Regards
ExcelDemy