Method 1 – Use of Filter Feature to Analyze Text Data in Excel
Steps:
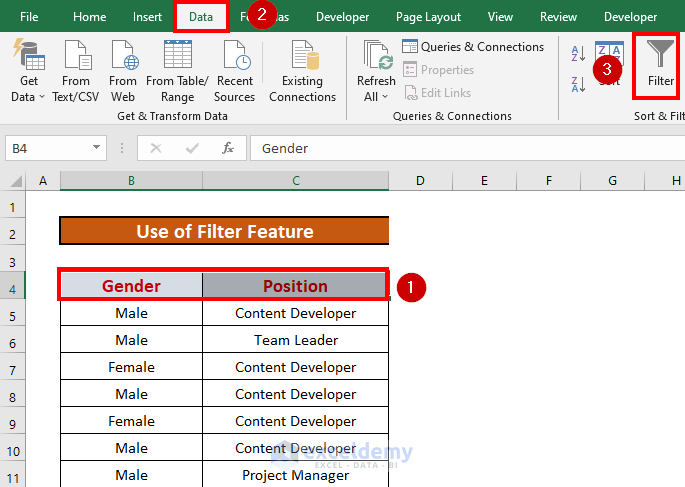
- Select the headings of your table. Go to the Data Tab >> select Filter.
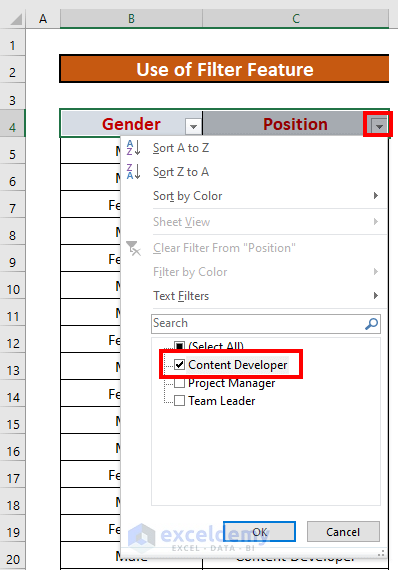
- Excel will create drop-down boxes in your headings. You can now filter your dataset using these drop-down boxes. If you want to see the list of all Content Developers, select the drop-down box of Position >> Check Content Developer. Click OK.
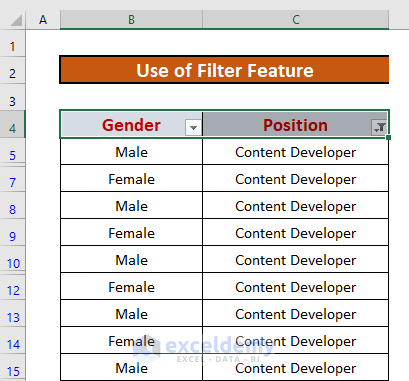
- Excel will get the list of all Content Developers.
Method 2 – Apply Functions to Analyze Text Data in Excel
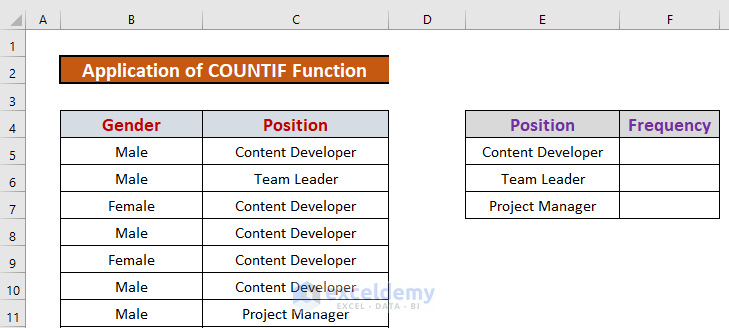
2.1. COUNTIF Function
Find out the number of employees in each position. Use the COUNTIF function.
Steps:
- Go to E5 and write down the formula
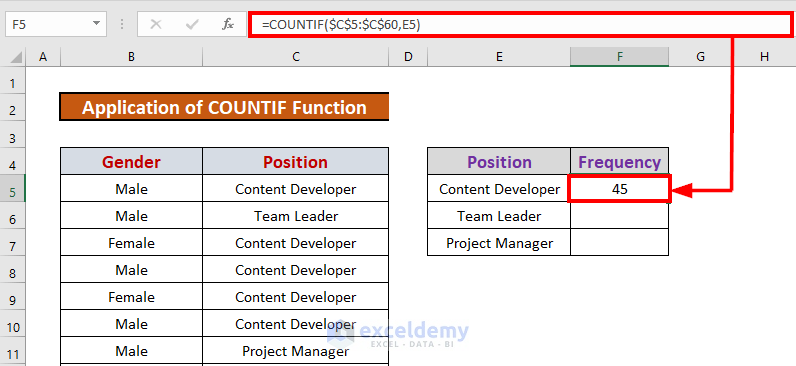
=COUNTIF($C$5:$C$60,E5)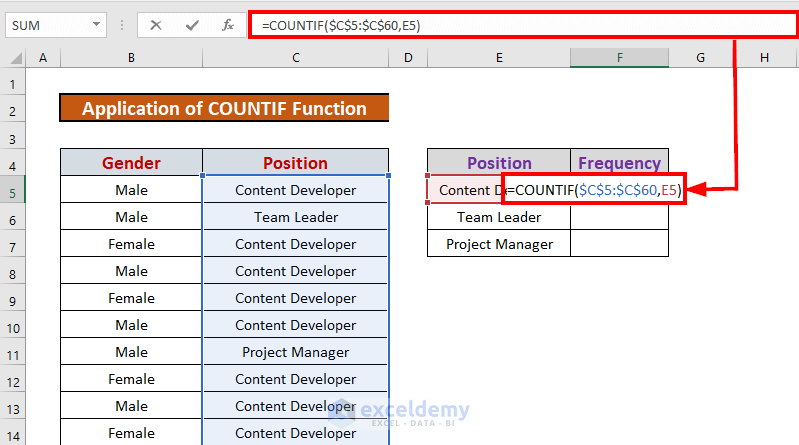
- Press ENTER. Excel will count the frequency for “Content Developer” from the range C5:C60.
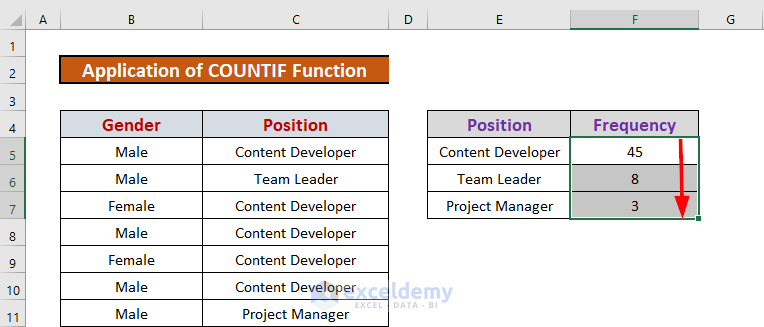
- Use Fill Handle to AutoFill up to F7.
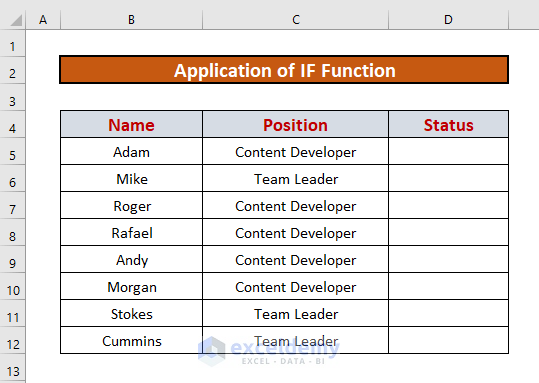
2.2. IF Function
We modified the dataset a little. The Name of some employees and their positions. Categorize them based on their position. “Content Developer” will be Category A, and “Team Leader” will be Category B.
Steps:
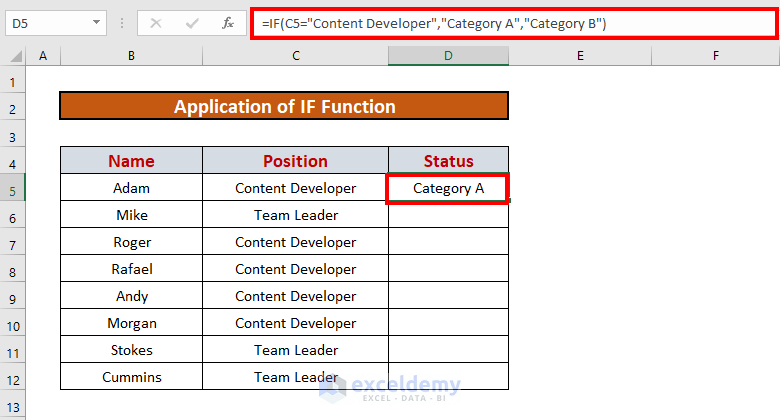
- Go to D5. Write down the formula
=IF(C5="Content Developer","Category A","Category B")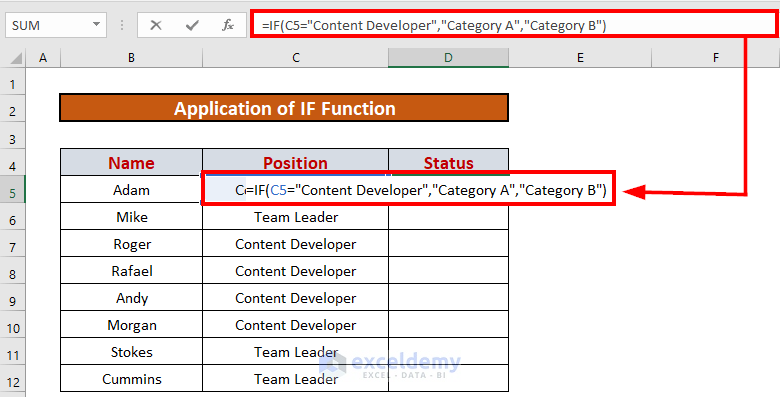
Explanation:
- The logical test is C5=”Content Developer”. If the test is TRUE, the output will be “Category A“. If it is FALSE, the output will be “Category B“.
- Press ENTER. Excel will return the output.
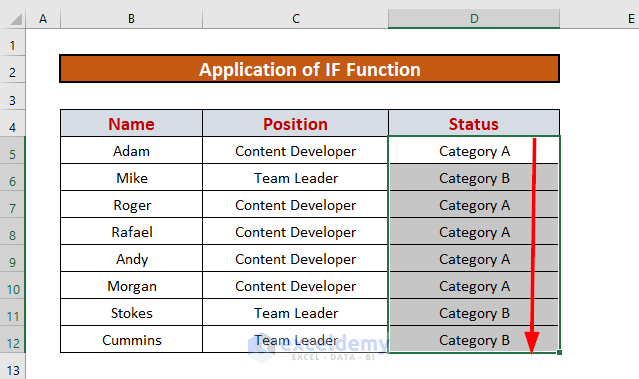
- Use Fill Handle to AutoFill up to D12.
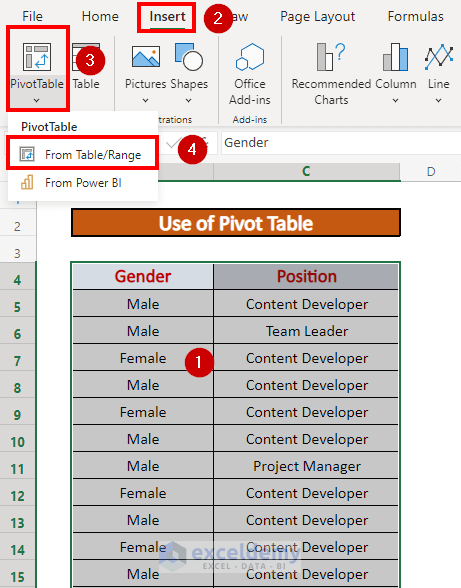
Method 3 – Use of Pivot Table to Analyze Text Data in Excel
Steps:
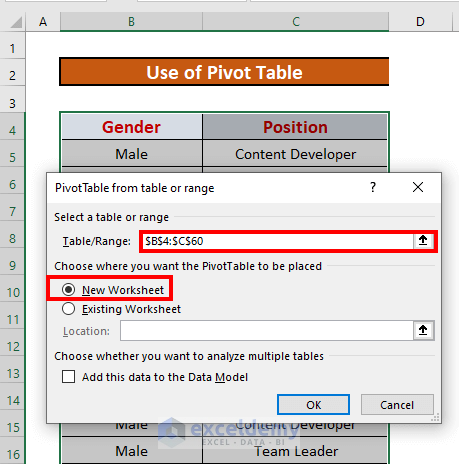
- Select the entire dataset B4:C60. Go to the Insert tab >> PivotTable >> select From Table/Range.
- A new window will appear. Enter the range and select New Worksheet to create a pivot table on a separate worksheet. Then click OK.
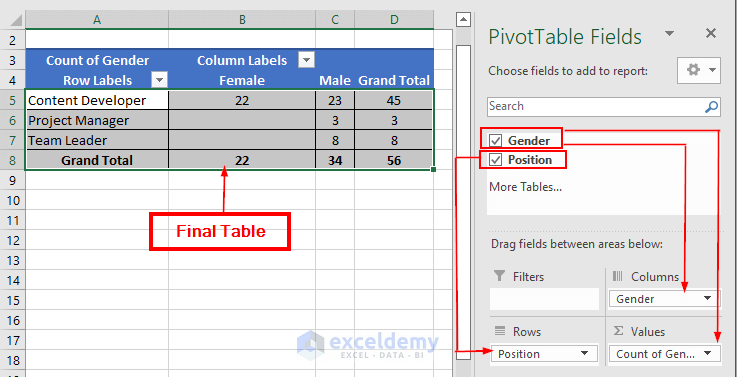
- Excel will create a pivot table. If you drag Position in Rows field and Gender in Values and Columns field, you will get this table.
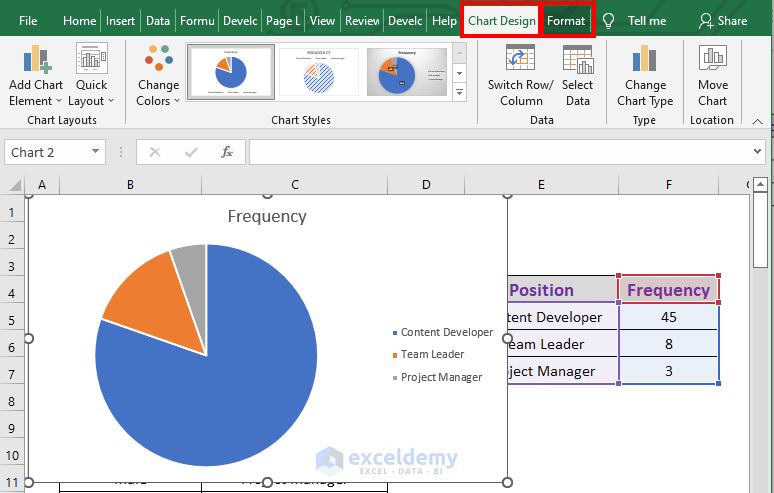
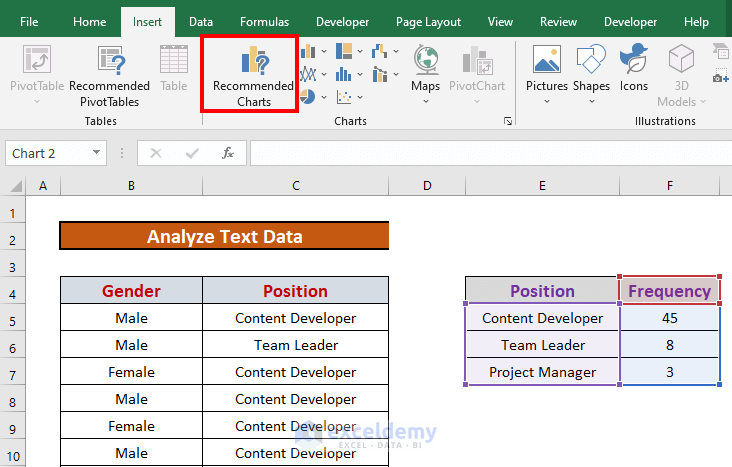
Method 4 – Apply Charts to Analyze Text Data in Excel
Steps:
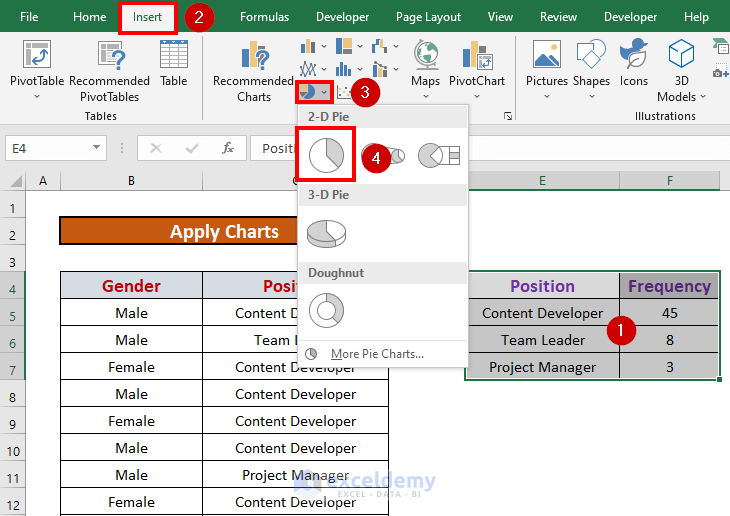
- Select E4:F7. Go to the Insert tab >> select the pie-chart icon >> choose a suitable pie-chart.
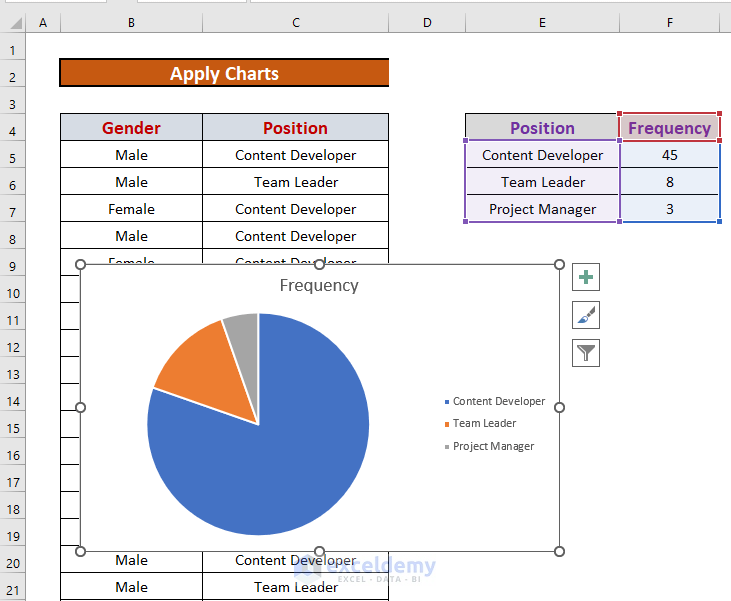
- Excel will create a pie chart.
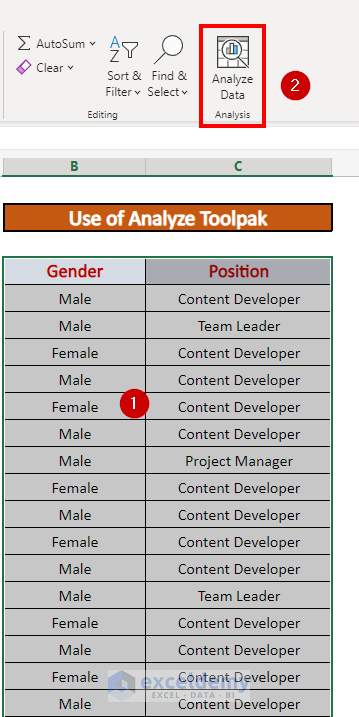
Method 5 – Use of Analysis Toolpak for Analyzing Text Data in Excel
Steps:
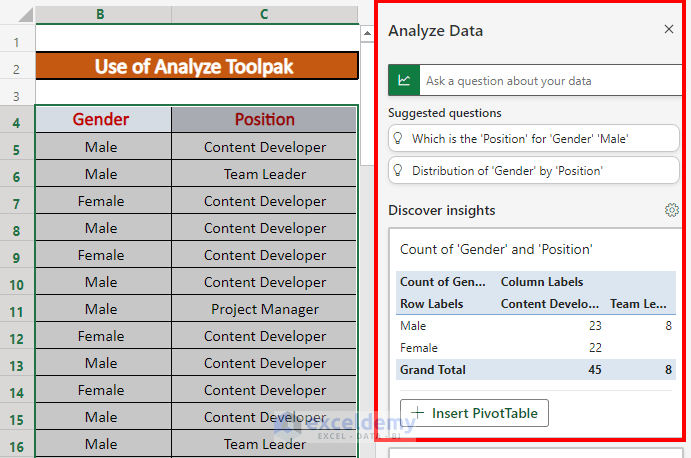
- Select B4:C60. Select the Analyze Data from the Home.
- Excel will show the analysis option in a new ribbon.
Things to Remember
- Use Absolute Reference ($) to lock the cell.
- Try different designs and formats for the charts.
- Excel recommends a list of charts for your dataset.
- Analyze Toolpak may not be available if you are using earlier versions of Excel.
Download Practice Workbook
Download this workbook and practice while going through the article.
Related Articles
- How to Analyze Sales Data in Excel
- How to Analyze Likert Scale Data in Excel
- How to Analyze qPCR Data in Excel
- How to Analyze Quantitative Data in Excel
- How to Analyze Qualitative Data in Excel
- How to Analyse Qualitative Data from a Questionnaire in Excel
- How to Convert Qualitative Data to Quantitative Data in Excel
<< Go Back to Data Analysis with Excel | Learn Excel
Get FREE Advanced Excel Exercises with Solutions!
