Step 1 – Input Time Series Data
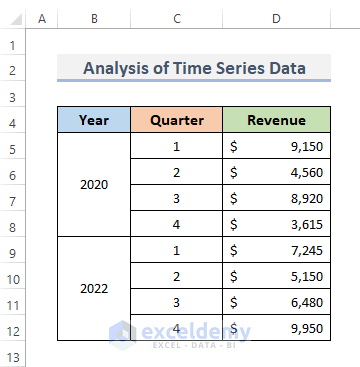
We are going to use a company’s quarterly revenue in two specific years.
- Put the year series data in column B. In our case, it has only been two years.
- Input the quarter of each year. You can use a repeating sequence for that or use AutoFill.
- Insert the total revenue in every quarter.
Read More: How to Analyze Raw Data in Excel
Step 2 – Enable the Data Analysis Feature
- Go to the File tab from the ribbon.
- Go to the Options menu.
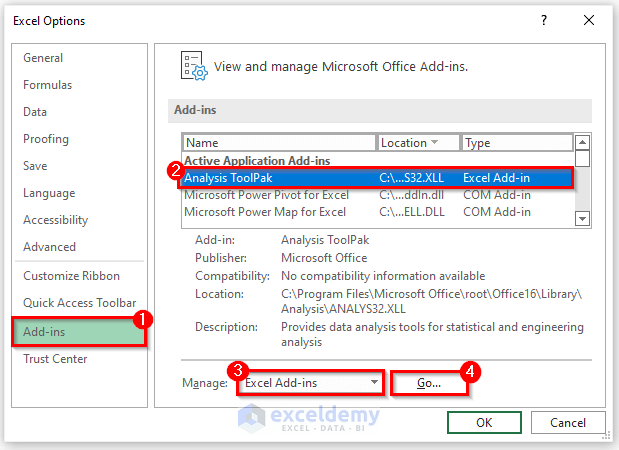
- The Excel Options dialog box will appear.
- Go to Add-ins and, under the Add-ins option, select the Analysis Toolpak.
- Choose the Excel Add-ins from the Manage drop-down menu.
- Click on the Go button.
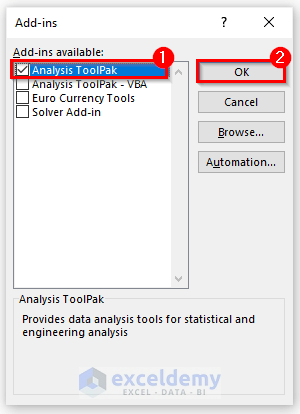
- The Add-ins window will come up.
- Check Analysis Toolpak.
- Click on the OK button.
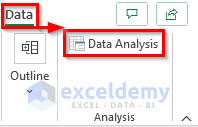
- We will get the Data Analysis button under the Data tab.
Read More: How to Analyze Large Data Sets in Excel
Step 3 – Execute the Statistical Analysis
- Go to the Data tab from the ribbon.
- Click on the Data Analysis tool under the Analysis group.
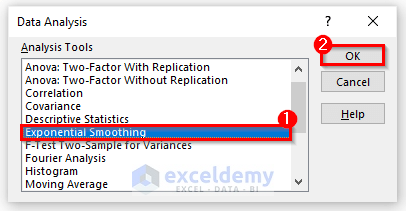
- The Data Analysis dialog box will pop up.
- Scroll down and select Exponential Smoothing.
- Click on the OK button.
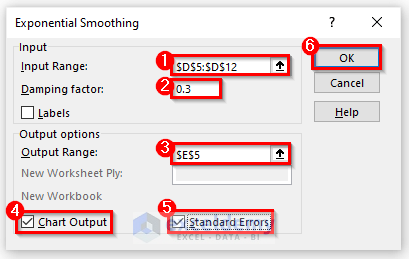
- This will display the Exponential Smoothing dialog box.
- Select the cell range in the Input Range field. In this case, we selected the range $D$5:$D$12, which is the Revenue column.
- Specify the Damping factor.
- Select the range $E$5 in the Output Range field.
- Check the Chart Output and Standard Errors boxes.
- Click OK.
Read More: How to Analyze Text Data in Excel
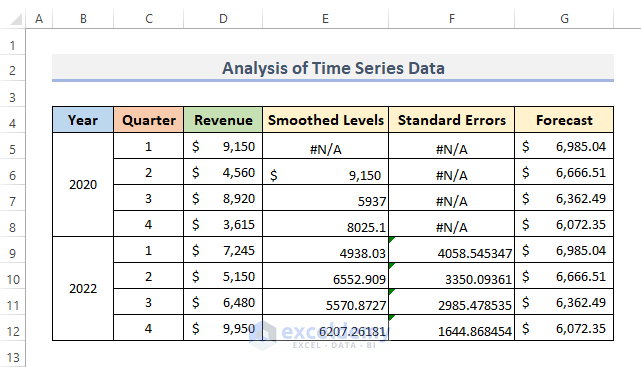
Final Output to Analyze Time Series Data in Excel
- The Smoothed Level and Standard Error columns represent the outcomes of the statistical analysis.
- In the smoothed levels, the column contains the following formula:
=0.7*D6+0.3*E6- For the standard errors, the formula is as follows.
=SQRT(SUMXMY2(D6:D8,E6:E8)/3)
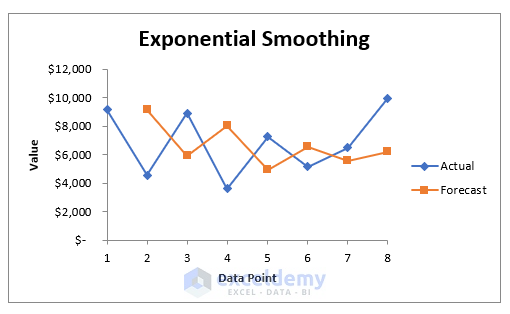
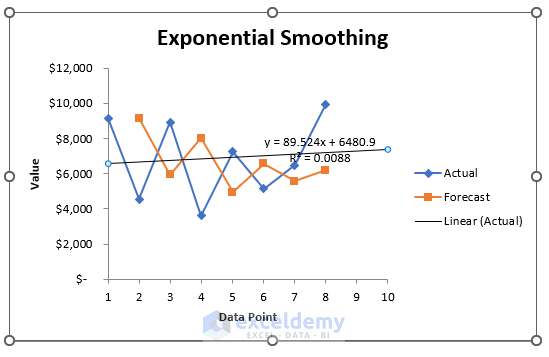
- We will also get a graphical representation of the Revenue and a forecast.
Read More: How to Analyze Sales Data in Excel
Time Series Forecasting in Excel
Steps:
- Select the Actual revenue curve line.
- Right-click and select Add Trendline.
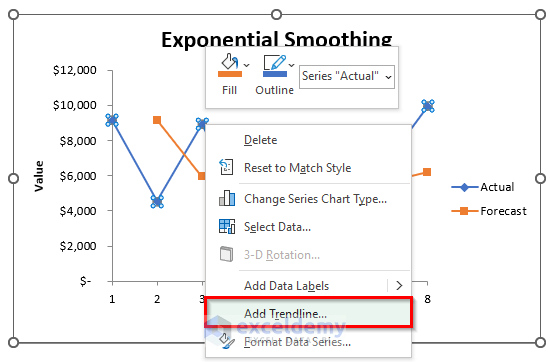
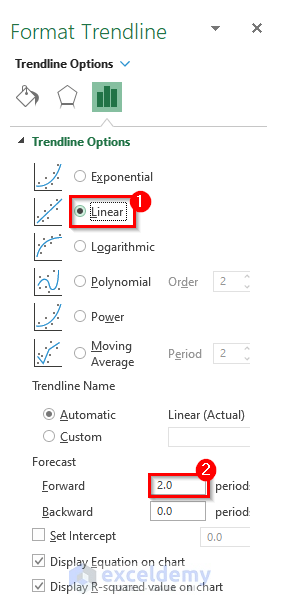
- The Format Trendline window will show up on the right side of the spreadsheets.
- Check Polynomial from the Trendline Options.
- Check the Display Equation on chart and Display R-squared value on chart boxes.
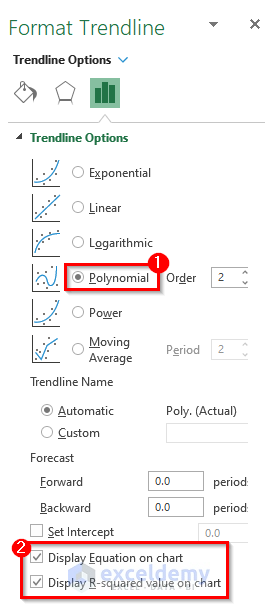
- In the forecast models, the polynomial trend line has a lower error rate.
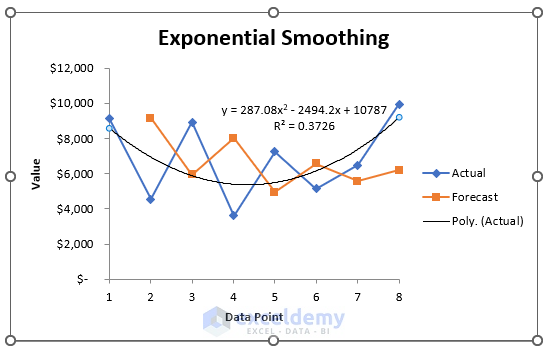
- The required trend line will be returned in the graph.
- Choose Linear if you like to have a linear trend line.
- In our case we put the Forward period under the Forecast option.
- This will display a linear trend line next to the actual data on the graph.
Suppose we want to forecast exponential dependence. GROWTH delivers the y-values for a set of new x-values. We can also use this function to fit an exponential curve to already-existing x- and y-values.
- Insert a new column named Forecast.
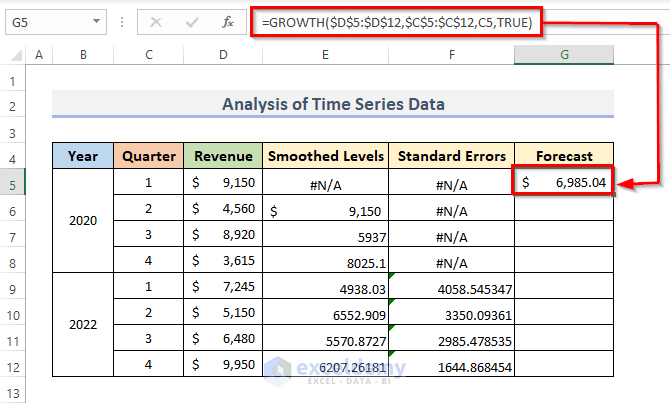
- Select the cell where you want the result of the forecast value using the GROWTH function.
- Put this formula into that selected cell.
=GROWTH($D$5:$D$12,$C$5:$C$12,C5,TRUE)- Hit the Enter key.
- Drag the Fill Handle down to duplicate the formula over the range or double-click on the plus (+) symbol.
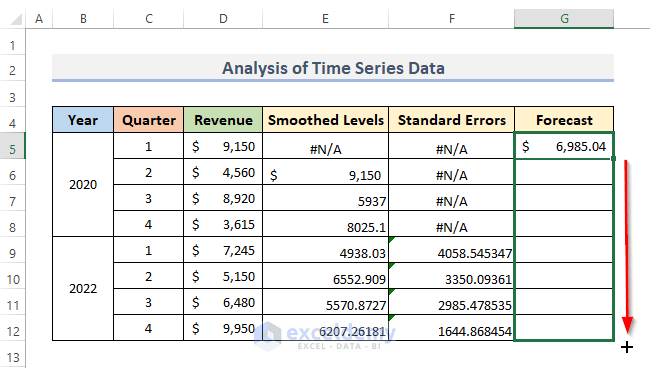
- You can see the prediction for the revenue.
 Read More: How to Analyze Likert Scale Data in Excel
Related Articles
- How to Analyze qPCR Data in Excel
- How to Analyze Quantitative Data in Excel
- How to Analyze Qualitative Data in Excel
- How to Analyse Qualitative Data from a Questionnaire in Excel
- How to Convert Qualitative Data to Quantitative Data in Excel
<< Go Back to Data Analysis with Excel | Learn Excel
Get FREE Advanced Excel Exercises with Solutions!

data chahiye
Hello Samia,
In the Download Practice Workbook section, you will get the dataset used in the article.
Regards
ExcelDemy