Consider an open-ended question in a company questionnaire.
It can not be answered Yes or No.
To analyse responses and determine the most significant theme:
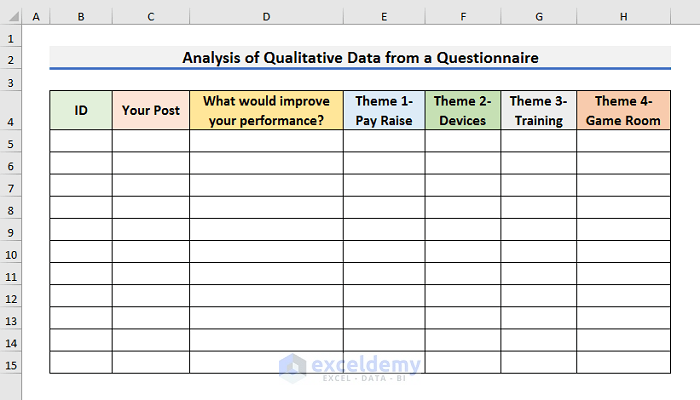
STEP 1 – Create a Dataset to Record Responses and Analyse Themes
- Create a dataset and record responses to analyse themes.
- Insert columns with the headers ID, Your Post, What would improve your performance?, Theme 1- Pay Raise, Theme 2- Devices, Theme 3- Training, and Theme 4- Game Room.
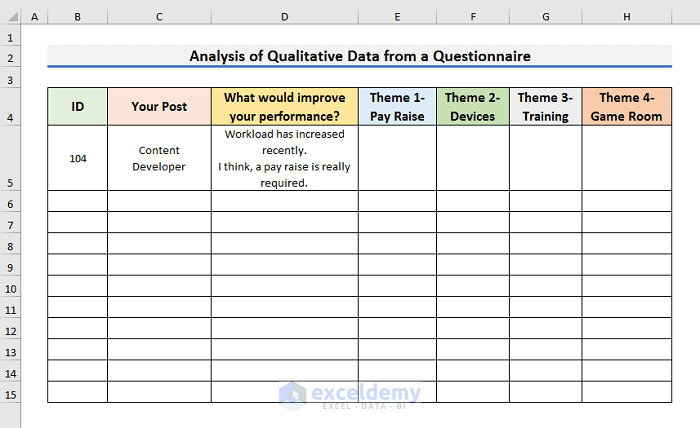
STEP 2 – Record ID, Post, and Responses
- Copy the ID, Post, and Response of each employee and paste it into the dataset.
This is the output.
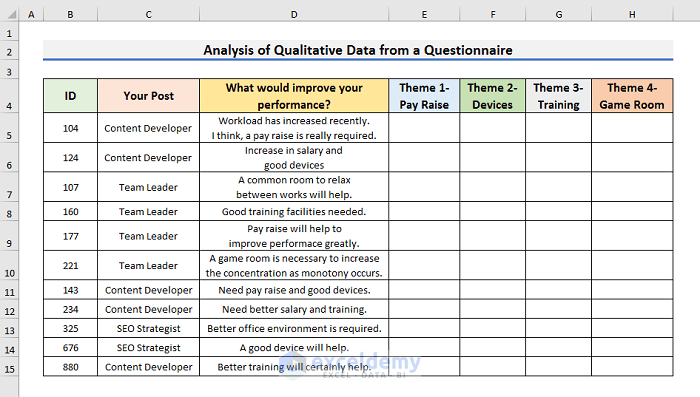
- Repeat the procedure to enter responses with IDs and Posts.
Read More: How to Analyze Quantitative Data in Excel
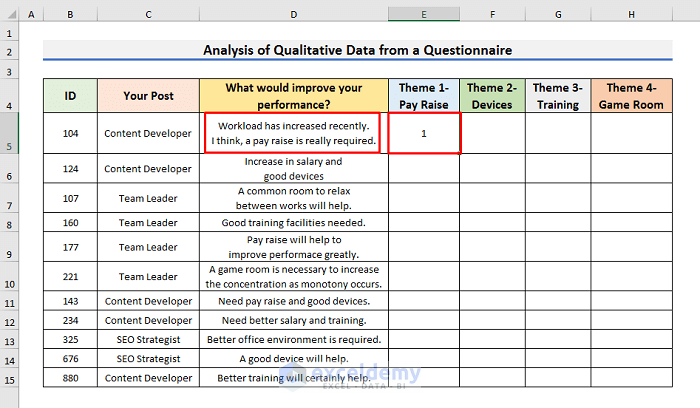
STEP 3 – Analyse Responses and Count Themes
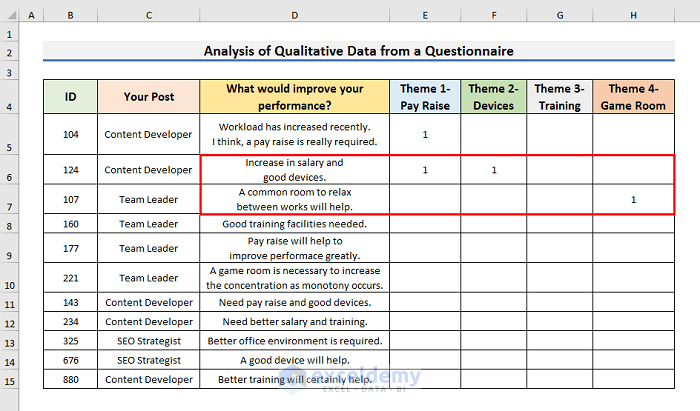
- Read the response and identify its theme.
For example, the first response states, ‘Workload has increased recently. I think a pay raise is really required.’ The employee is indicating Theme 1- Pay Raise.
- Enter 1 in E5.
- In the second response, there are two themes; Pay Raise and Devices.
- The theme in the third response is Game Room.
- Enter 1 in each case.
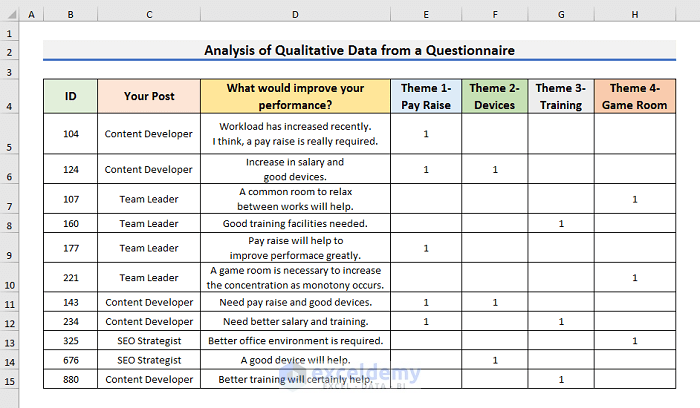
- Follow the same steps to count the number of themes of each response.
Read More: How to Analyze Qualitative Data in Excel
STEP 4 – Insert a Pivot Table
- Select a cell in the dataset.
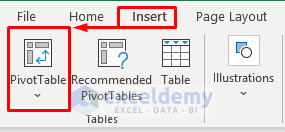
- Go to the Insert tab and click Pivot Table.
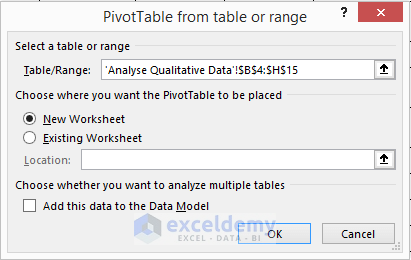
- In the dialog box, click OK .
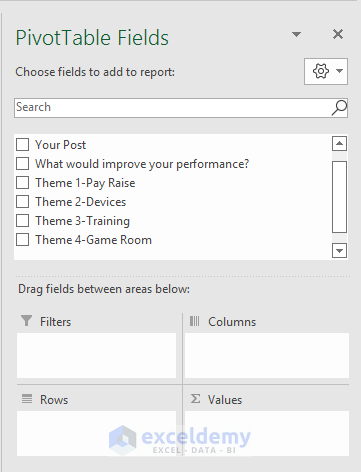
A new window will be displayed with the PivotTable Fields:
Read More: How to Convert Qualitative Data to Quantitative Data in Excel
STEP 5 – Calculate the Sum of Each Theme
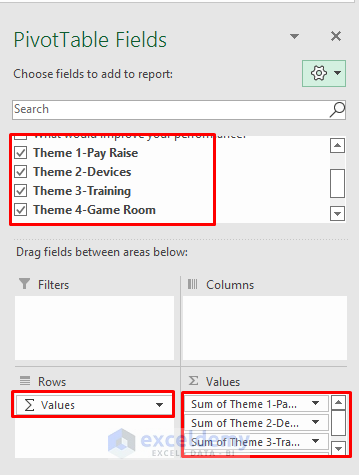
- Select Theme 1, Theme 2, Theme 3, and Theme 4 in ‘Choose fields to add to report’.
- Drag ‘Values’ to Rows.
- Drag Sum of Theme 1, Sum of Theme 2, Sum of Theme 3, and Sum of Theme 4 to Values.
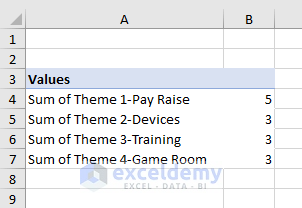
The sum of each theme will be displayed in the Pivot Table.
Read More: How to Analyze Large Data Sets in Excel
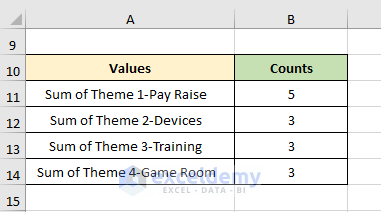
STEP 6 – Find the Total Number of Themes
- Copy the Pivot Table and paste it in the sheet.
- Select B16 and enter the formula below:
=SUM(B11:B14)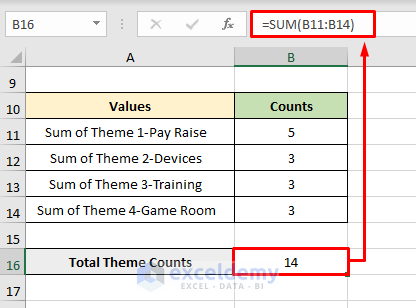
The SUM function calculates the total number of themes in the responses.
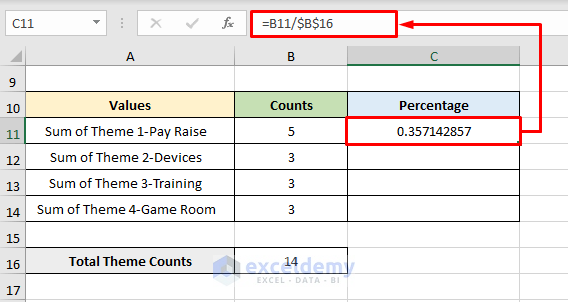
STEP 7 – Find the Most Significant Theme in Percentage
- Add another column. Here, ‘Percentage’.
- Select C11 and enter the formula below:
=B11/$B$16- Press Enter to see the result.
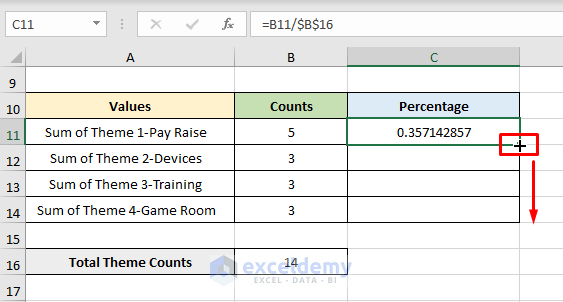
- Drag down the Fill Handle to see the result in the rest of the cells.
This is the output.
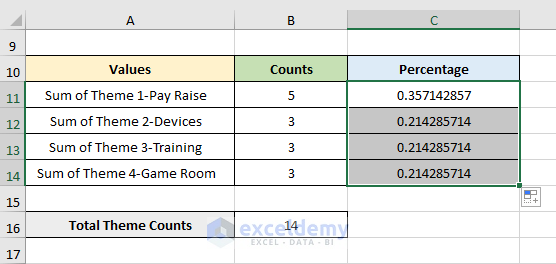
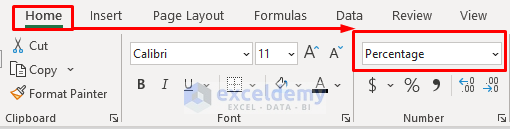
- Select C11:C14.
- Go to the Home tab and select Percentage in Number.
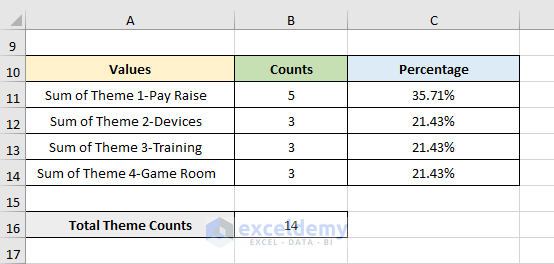
Final Result
The findings show that Theme 1- Pay Raise is the most significant theme.
Read More: How to Analyze Raw Data in Excel
Download Practice Book
Download the workbook.
Related Articles
- How to Analyze Text Data in Excel
- How to Analyze Time Series Data in Excel
- How to Analyze Sales Data in Excel
- How to Analyze Likert Scale Data in Excel
- How to Analyze qPCR Data in Excel
<< Go Back to Data Analysis with Excel | Learn Excel
Get FREE Advanced Excel Exercises with Solutions!
